Geography Reference
In-Depth Information
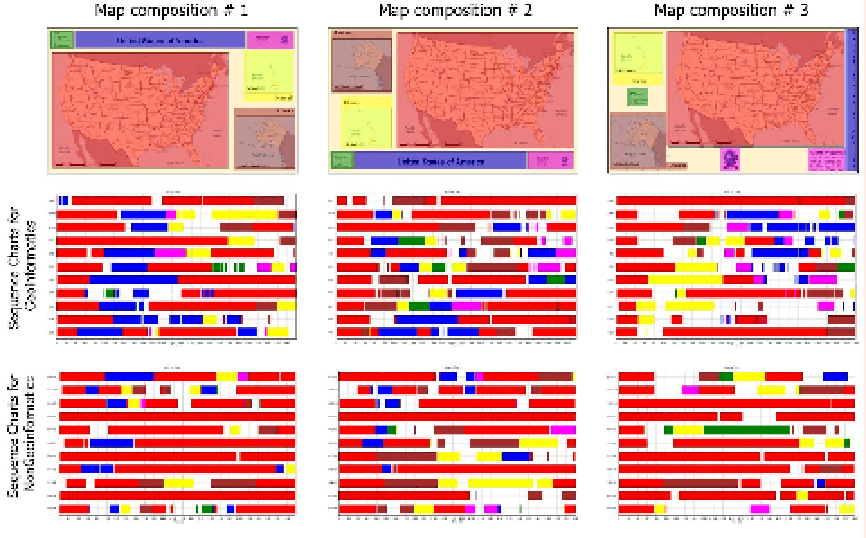
was to reveal differences in reading of a simple map by a group of students of cartography
and cartography amateurs. Three different map compositions are displayed in figure 6.
Maps (presented in the first row of figure 6) were projected in 5s intervals during which the
respondents have to observe maps without answering any question. The second raw in the
Figure 6 shows a sequence chart for a group of students of Geoinformatics and cartography,
who have attended several cartography courses. The last row represents data given by
cartographic amateurs, students of psychology, zoology etc.
Each stimulus was preceded by a short cross used to locate beginning of all trajectories at
the same place (in the middle of the picture). That is why the AOI representing the map field
is always pictured in first 500 ms. After this time; most geoinformatics students
automatically read the title of the map, or rather noted fixations representing it in AOI.
Cartographic amateurs did not do so. It is evident especially in the first column, where the
stimulus was the “ideal” map composition [43]. In following columns, the composition was
not in accordance with cartographic rules. Despite this fact, students of geoinformatics were
trying to find the title of the map.
Figure 6.
Sequence chart visualization. Sample data of the Esri were used for the creation of stimulus
maps
The Sequence Chart is illustrative and easy to interpret, but it is necessary to evaluate the
data by statistical approach.
The objective of the statistical hypotheses testing is to evaluate the data gained from
experiments and the suitability of the purpose given before the testing. Statistical hypothesis
is a certain purpose about the distribution of accidental quantities of a basic file.