Geography Reference
In-Depth Information
measurement or calibration deflection. By means of HeatMaps, it is possible to get an
overview of possible measurement inaccuracies and so to adapt the Area of Interest.
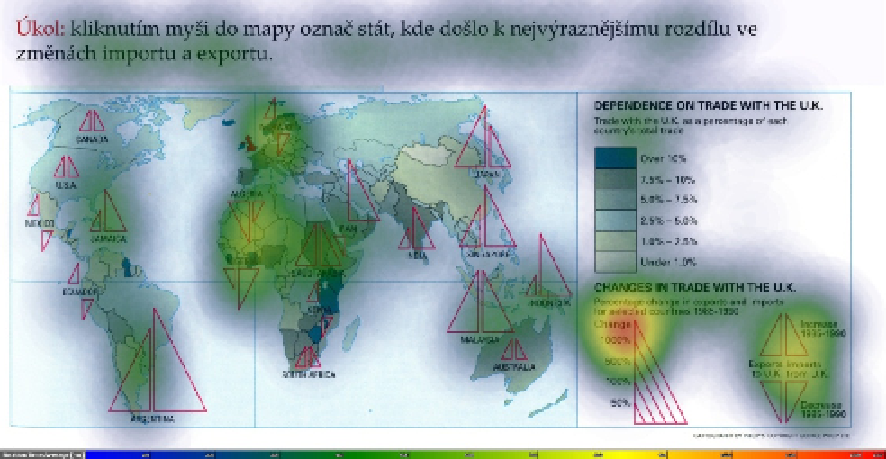
HeatMaps produced by SMI software BeGaze are created in two steps. The software first
scales each pixel in proportion to the durations of all fixations landing on it. Typically, this
results in a very sparse “Fixation Hit Map”, since only a small proportion of the pixels have
been “hit”. In next step, the hit map is convolved with a Gaussian kernel with certain width.
A wider kernel gives a smoother, less pointy appearance to the attention map [20].
Figure 5.
HeatMap created from fixations of seven respondents
4.4. Area of Interest
Areas of Interest (AOI) are regions in the stimulus which the researcher is interested in. The
most important AOI metric is the dwell time defined as one visit in AOI, from entry to the
exit. The dwell has its own duration, the starting point, the ending point, dispersion etc. In
several ways, it is similar to a fixation, but it is of much larger entity, both in space and time
[20]. It is also possible to follow the order in which the respondent looked at particular areas
or the transition, the movement from one AOI to another etc.
In cartography the Areas of Interest analysis can be used advantageously. AOI analyses are
based on evaluation of concrete parts of a map (legend, scale, title, specific phenomena in
the map, etc.). When evaluating influence of a composition on the map reading, the
application of AOI is very useful. By indicating and evaluating particular compositional
elements as AOI, several characteristics can be find out - e.g. for how long the respondent
was observing the given area, in which order he visited them etc.
The results can be visualized with use of the Sequence Chart, which displays observed areas
in different colours on a timeline. Figure 6 shows results of an experiment, whose objective

