Database Reference
In-Depth Information
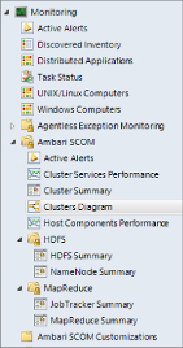
Figure 16.9
Ambari SCOM folders
It will take a few minutes for SCOM to start collecting statistics from your
cluster, so the first good place to look is the Clusters Diagram page.
Figure
16.10
shows our cluster build from Chapter 3. While it's a single node
cluster, you can see all the services running and their status based off of the
green check marks.
Figure 16.10
Cluster diagram
The whole purpose of going through the pain of this section is so that you
can monitor your Hadoop clusters from a central location. Essential to any
good monitoring solution is the ability to alert you when something goes