Database Reference
In-Depth Information
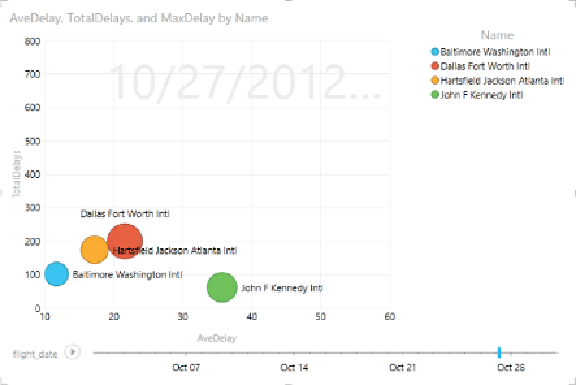
Figure 11.34
A bubble chart comparing airport delays.
One of the most interesting ways to analyze data that contains a geographic
component, such as latitude and longitude, is to graph the data on a map.
In the next section, you will use a new tool from Microsoft, Power Map, to
visualize the data.
Spatial Exploration with Power Map
Although you can create a map-based visualization using Power View and
geocoded data such as city and state, it is very limited and provides only
two-dimensional maps, where data is represented by the size of a bubble
(see
Figure 11.4
). If you need to conduct more powerful spatial analysis of
your geocoded data, Power Map is definitely the tool to use. Power Map is
a free add-in to Excel, just like PowerPivot and Power View. It uses Bing
mapping technology to create a map layer using geocoded data such as
longitude and latitude, city, state, country, and ZIP code. You can display
the data on top of the map as a three-dimensional bar chart, heat map,
bubble chart, or color shading of regional boundaries. For example,
Figure
11.35
showstherainfallamountsforthevariouscountiesascolumnsandthe
population of the county represented by the county shading:
1. To map some data using Power Map, open the Excel workbook you used
in the previous sections.