Database Reference
In-Depth Information
3. Right-click the carrier_cd field in the flight_dept table and select Hide
from Client Tools.
4. Repeat the procedure in step 3 for the airport_cd field.
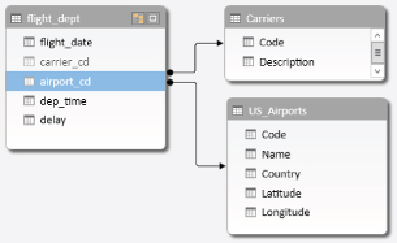
Your model should look like
Figure 11.21
.
Figure 11.21
The updated model.
The next step you need to do is create some measures in the model that will
aid in analyzing the data.
Adding Measures
In this section, you create aggregations to count, average, and find the
maximum delays:
1. Switch to the data view of the model and click the flight_dept tab. Select
the first cell in the measure area below the grid and add the following
DAX code to the formula bar to count the number of delays (see
Figure
11.22
):
TotalDelays:=Count([delay])