Information Technology Reference
In-Depth Information
noise margins between low and high signal values because the two aTc input
levels shown are immediately before and after the sharp transition from high
to low output.
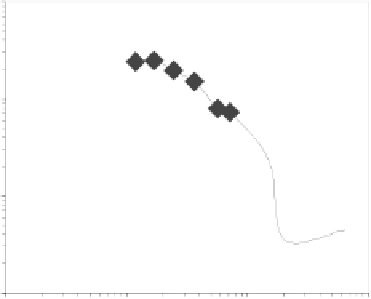
Figure 7.6b illustrates the transfer function of the circuit with respect to the
level of the inducer. The figure relates aTc input levels to YFP output fluores-
cence levels, with error bars depicting the range that includes 95% of the flow
cytometry fluorescence intensities of the cells recorded for the particular aTc
level. The favorable noise margins and signal restoration of this circuit clearly
demonstrate that digital-logic computation is feasible with genetic circuits.
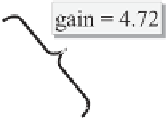
By correlating ECFP and EYFP readings for the same experiment, Fig-
ure 7.7 shows the normalized transfer curve of the lacI/p(lac) inverter. The
ECFP fluorescence intensities are normalized to the EYFP levels based on
the experimental results described in the previous subsection. After normal-
ization, each point represents the median fluorescence intensities for a par-
ticular experimental condition of the input signal (ECFP) versus the output
signal (EYFP). The gain of the inverter of 4
.
72 is sufficient for digital-logic
computation and is likely to be related to the pentameric nature of
lacI
repres-
sion [9].
The lacI/p(lac) gate characterized in this section is the first component of the
cellular gate library. Next, we describe the addition of the second component to
the gate library, the
cI
/
λ
P(R
−
O
12
)
inverter. In particular, the following section
demonstrates genetic process engineering to optimize the original behavior of
this gate and to obtain the desired behavior for digital computation.
Figure 7.7
The lacI/p(lac) transfer curve.