Information Technology Reference
In-Depth Information
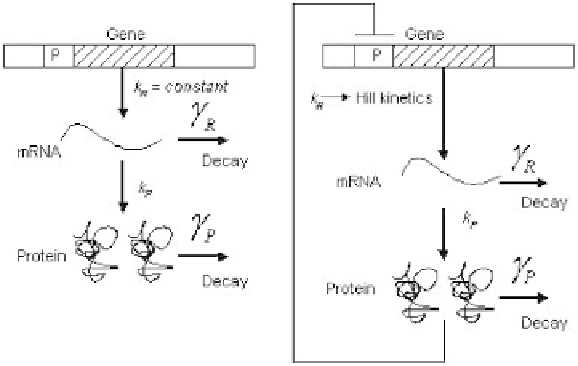
Figure 5.8
Model of single gene expression. (a) mRNA molecules are synthesized
from the template DNA strand at rate
k
R
, and proteins are translated at a rate of
k
P
off of each mRNA molecule.
γ
R
and
γ
P
are the decay rates for mRNA and protein,
respectively. (b) The same as panel a, except that the protein is negatively autoregu-
lated. We model the autoregulation using a Hill expression such that
k
R
=
k
R
max
/(
1
+
(p/k
d
)
n
, where
k
R
max
is the maximum rate of transcription,
k
d
is the concentration of
protein where
k
R
=
k
R
max
/
2, and
n
is the Hill coefficient.
function,
γ
p
is the protein decay rate,
γ
R
is the mRNA decay rate, and
f
α
is a
single-pole approximation of repression dynamics [95].
The frequency domain analysis of gene circuits like that shown in Figure
5.8b revealed two significant implications of negative autoregulation [95]. First,
the noise strength (variance/mean) of the protein population in negatively au-
toregulated circuits is reduced by 1
/
[1
] compared to open-loop gene
circuits (Figure 5.8a). Second, autoregulation has an additional but more subtle
effect on noise behavior that is not explicitly shown by other analyses. The noise
bandwidth of the autoregulated circuit is increased by a factor of 1
+|
T(
0
)
|
|
compared to the unregulated case. Thus, not only are the variance and standard
deviation of the noise reduced by feedback, the noise that remains is shifted to
higher frequencies (Figure 5.9).
It is possible that noise shifted to higher frequencies through the action of
feedback may be filtered by downstream gene circuits [95]. There are electronic
circuit-processing schemes that optimize performance by shifting noise into a
frequency regime where it has a smaller impact on total system performance
(e.g., sigma-delta analog-to-digital converters). Similar schemes could be used
in engineered genetic circuits and may have evolved within natural genetic
circuits.
+|
T(
0
)