Biomedical Engineering Reference
In-Depth Information
exposed to betaferon at 2000 international units (IU) mL
1
, there is a change in
both the surface potential value (
350 mV), and in the overall shape of the
scan as shown in Figure 5.17(c). Clearly, the instrument is detecting not only
changes in the local distribution of charges, ion, and membrane permeability
caused by the drug, but also subtle shape changes due to movements in the
cytoskeleton matrix.
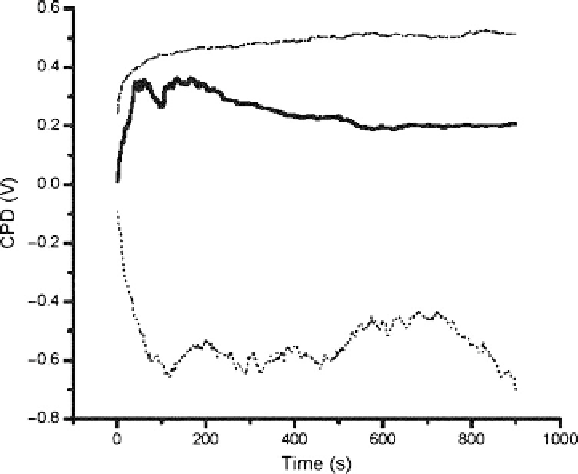
In order to focus on the alterations taking place in time with respect to a
specific neuron, a real-time localized measurement at a single point over one
single cell can be performed. The scanning protocol was altered to allow
vibration of the probe over one single neuron.
22
In this experiment, the neuron
was exposed to the same drug but at increased concentration. Time-dependent
changes in the measured potential were found as shown in Figure 5.18. An
abrupt 350mV increase in the contact potential difference (CPD) can be
noticed when the neuron was exposed to 1000 IU mL
1
betaferon, confirmed
by a decrease of about 150mV. There was no such decrease when the neuron
was subjected to 2000 IU mL
1
of the drug; the first 100 s showed a 280mV
increase and then a slight saturation of cell receptors after approximately 500 s.
For 4000 IU mL
1
there was a 600 mV initial decrease of the signal, followed
by a rise to a maximum of 300 mV. Subsequently, there was a 350mV decrease
at the end of the observation period.
B
d
n
4
t
3
n
g
|
2
n
3
.
Figure 5.18
Changes in the measured work function of one particular neuron after
the addition of betaferon at different concentrations. The solid line (—) is
betaferon at 1000 IU mL
1
, the dash-dotted line (-.-) is betaferon at 2000
IU mL
1
and the dotted line (...) is betaferon at 4000 IU mL
1
.
22
(Reprinted by kind permission of the Royal Society of Chemistry.)