Geoscience Reference
In-Depth Information
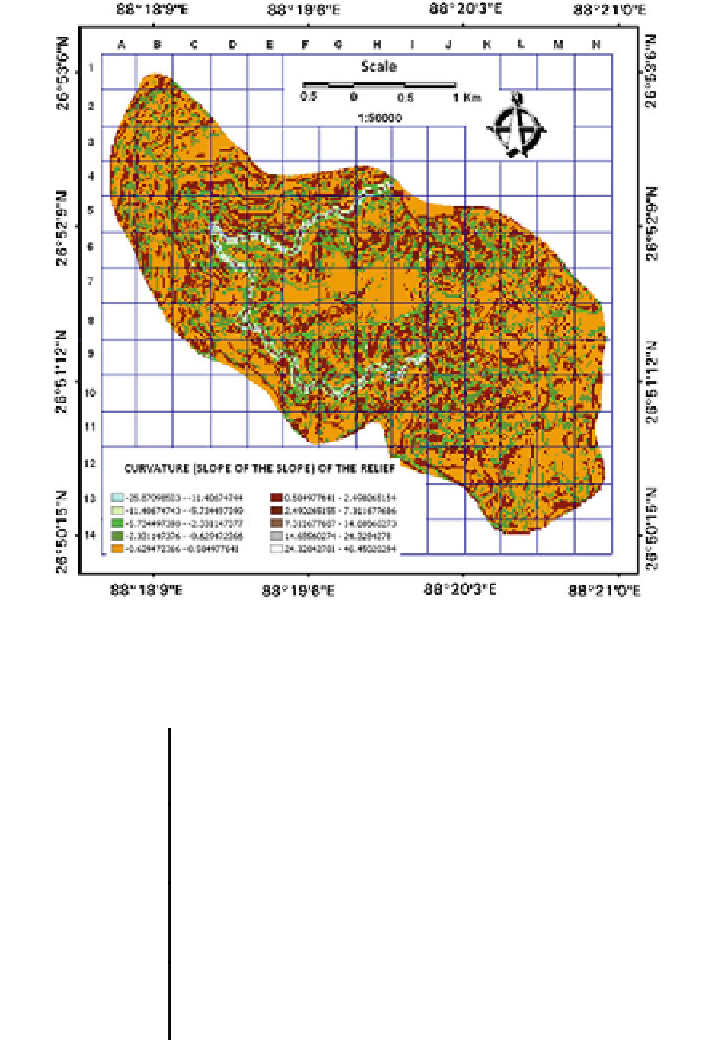
Fig. 2.8 Slope curvature map
Table 2.7 Curvature and landslide potentiality index (LPIV)
Classes (value of
slope curvature)
Number of
pixels (F
1
)
Number of landslide
affected pixels (F
2
)
Landslide potentiality index
(LPI) = (F
2
/F
1
×
100)
−
25.87 to
−
11.41
995
221
22.21
11.41 to
5.73
785
210
26.75
−
−
5.73 to
2.33
2,111
486
23.02
−
−
−
2.33 to
−
0.63
2,431
374
15.39
0.63 to 0.50
1,0045
388
3.84
−
0.50
2.49
6,302
268
4.25
-
2.49
-
7.31
5,438
464
8.53
7.31
14.69
3,343
475
14.21
-
14.69
24.33
895
222
24.80
-
24.33
-
46.45
786
265
33.71


Search WWH ::

Custom Search