Geoscience Reference
In-Depth Information
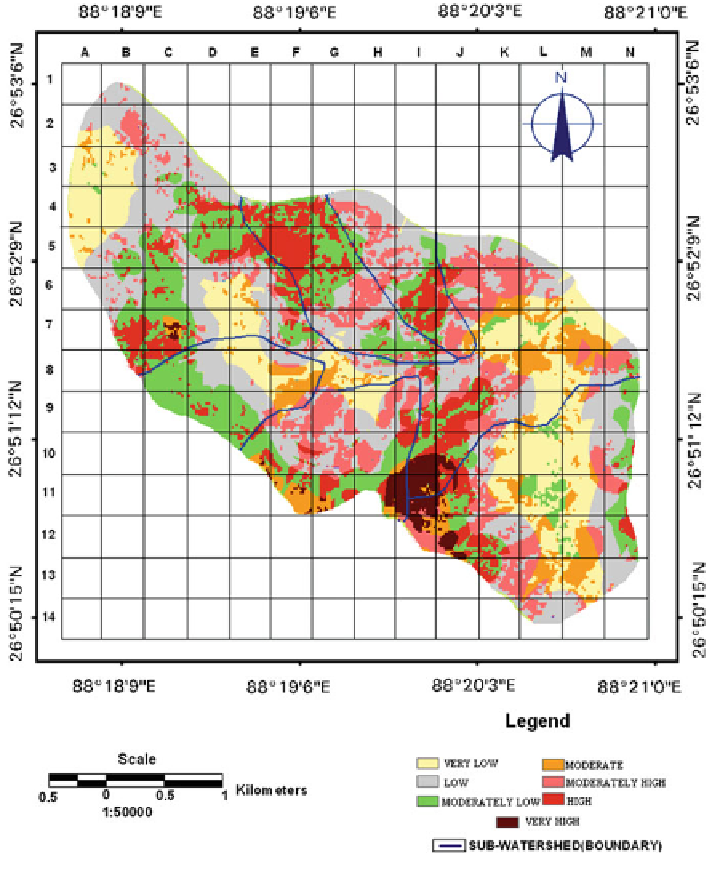
Fig. 7.7 Risk exposure/intensity map
and very landslides susceptibility are expected to have fresh landslide phenomena
and here lies the validity of the present landslide susceptibility mapping approach.
A relationship was established between landslide potential index and landslide
affected pixels which show that 27.22, 45, 50.03, 76.03 and 95.62 % landslide
affected areas are distributed in 8.75, 28.66, 45, 78 and 92 % landslide susceptible
areas. Around 35 % landslide affected pixels are distributed in 27 % of high to very
high landslide potentiality zones that indicate the higher probability of landslide
activities (Fig.
7.9
). On the other hand 73 % landslide susceptible areas are
attributed with 65 % landslide affected pixels.
Search WWH ::

Custom Search