Geoscience Reference
In-Depth Information
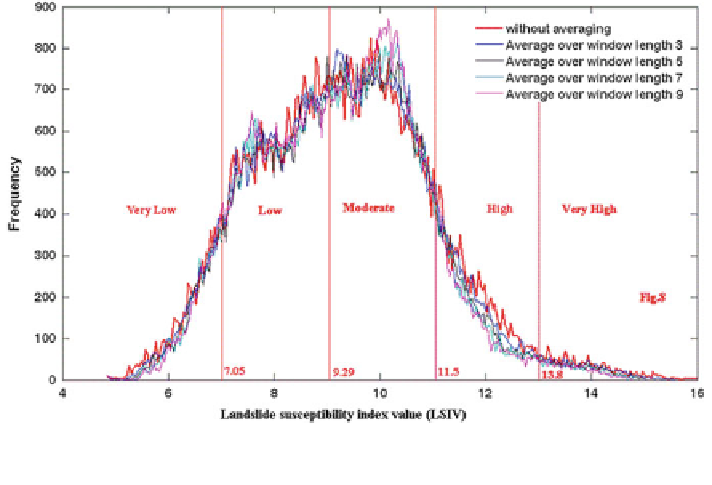
Fig. 7.2 Frequency distribution of
landslide susceptibility index value of
the Shiv-khola
watershed in West Bengal, India
7.2.1.7 Accuracy Assessment of the Landslide Susceptibility Map
with Field Data (GPS Survey)
Accuracy assessment
cation with
geographical data that are assumed to be true, in order to determine the classifi-
is a general
term for comparing the classi
-
cation process that was accomplished by using Erdas Imagine (8.5). True data were
derived by ground truth veri
cation with the help of GPS from the existing 50
landslide locations. Simultaneously, a set of randomly selected 50 reference pixels
points from the classi
ed image corresponding to the true data (GPS record) were
used for evaluating the validity of landslide susceptibility map after Congalton
(
1991
).
7.2.2 Landslide Risk Assessment
In this study, landslide risk map was made with the help of following principle
(Mandal and Maiti
2012
).
Landslide Hazard Risk = Landslide susceptibility
×
Landslide Risk Exposure/
Intensity of Risk Elements.
The entire methodology to prepare the landslide hazard risk map of the Shiv-
khola Watershed could be summarized under following heads (Fig.
7.3
).
Search WWH ::

Custom Search