Geology Reference
In-Depth Information
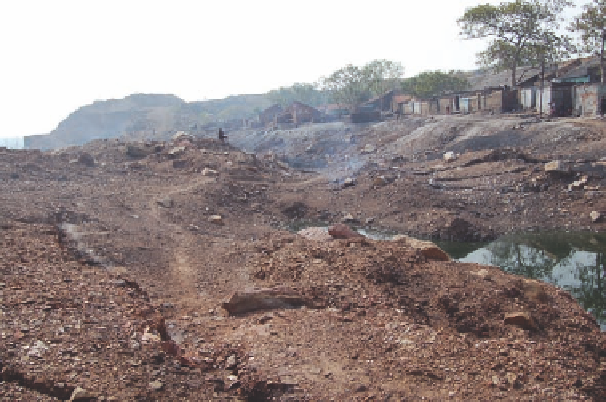
Figure 14.4.1. Photograph from the Jharia coalfield, India, showing a typical landscape associated with an area
affected by underground fire. The land over the subsurface fire shows several fissures and cracks, some of which
may extend for hundreds of meters in length. Photo by Anupma Prakash, 2006.
A
B
C
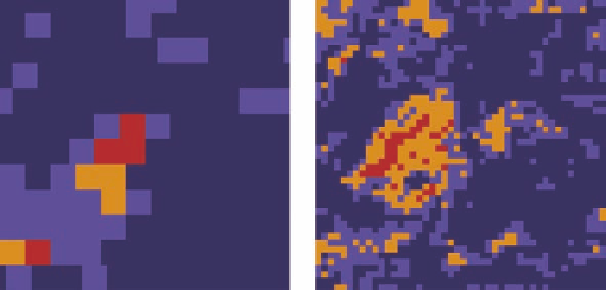
Figure 14.4.2. (A) Thermal infrared image, (B) red band image, and (C) near-infrared image subset of an area
above an underground fire. Each subset represents 1.4 km by 1.4 km block. Red represents the highest range of DN
values; yellow and light blue represent successively lower DN value range; and blue represents lowest background
DN values in each band. It is interpreted that heating due to subsurface fires has raised surface temperature, caused
drying of the soil, increased reflectance in red and near-infrared bands and also rendered the soil locally unfit to
support vegetation. Image reprocessed; based on Gupta and Prakash 1998.
Land-Cover (Coal Area) Mapping
O
ne of the popular applications of remote sensing in a mining area is for creating classified land-cover and land-use
maps. Extensive discussion on various classification schemes for land-cover mapping and the detection of land-
cover change is available in the published literature (Lambin and Ehrlich, 1996; Lu et al., 2004; Xie et al., 2008).
Two issues complicate land-cover mapping in a coal-mining area. The first is the spectral similarity of exposed
bodies of coal and water and the second is the presence of fires.
To differentiate between exposed coal and water on Landsat images, Prakash and Gupta (1998) used a false color
composite comprising Landsat bands 5, 4, and 2 coded in red, green, and blue, respectively. For this specific
combination, the coal outcrops appeared in shades of brownish-black, whereas water bodies appeared in shades of
bluish-black.