Geology Reference
In-Depth Information
Wavelength [m]
10
-11
10
-9
10
-7
10
-5
10
-3
10
-1
10
1
10
3
Gamma
rays
Ultra
violet
X-rays
Infrared
Microwaves
Radio frequency
10
20
10
18
10
16
10
14
10
12
10
10
10
8
10
6
10
4
Frequency (S
-1
)
Visible region
400
500
600
700
750
nm
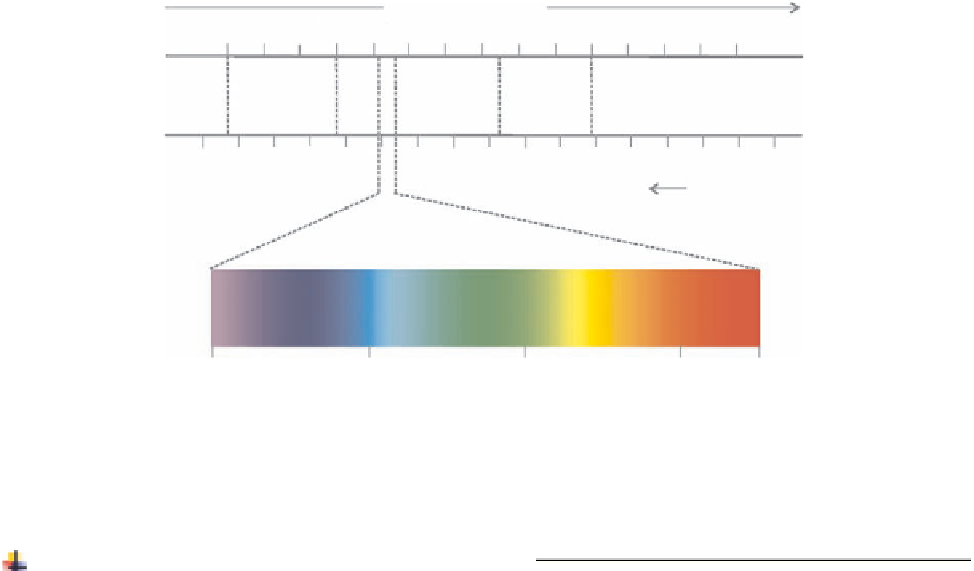
Figure 14.2.2. The electromagnetic spectrum from short wavelength and high frequency gamma rays to long
wavelength and low frequency radio waves. Visible light constitutes a very small portion of the electromagnetic
spectrum. From Quattrochi et al. 2009.
Visible and Near-Infrared Regions
V
isible light, to which the human eye is sensitive, constitutes only a tiny part of the electromagnetic spectrum.
Though traditional remote sensing (historic-aerial photography) relied on acquiring data only in this visible part of
the spectrum, modern-day sensors acquire data in several different wavelength ranges well beyond the sensitivity
of the human eye. This capability of current remote sensing sensors helps us to retrieve new information about the
target, which is not possible by simple observations in the field and just a few decades ago was not even
conceivable to achieve.
Another important concept to understand is that remote sensing sensors can operate in very small wavelength
ranges (narrow bands) or can acquire data integrated over a large span of wavelengths (broad band). When data is
available in a few narrow spectral bands, we refer to this as multispectral remote sensing. As the bands become
narrower, more numerous and nearly continuous across a portion of the spectrum, we transition from the realm of
multispectral remote sensing to hyperspectral remote sensing. As different Earth surface material
s respond rather
uniquely in different spectral regions, when remote sensing is carried out in narrow and near-contiguous spectral
bands, this spectral information, also known as spectral response curve or reflection spectra or spectral signature,
becomes diagnostic of the target material. Extensive libraries of reflection spectra of man-made materials and
natural materials (minerals, soils, rocks, vegetation, etc.) are now available. Spectral libraries from the US
Geological Survey and Jet Propulsion Laboratory (WWW Addresses: Additional Reading at the end of this
chapter) are among the best ones known, and these have even been integrated in some commercially available
digital image processing software packages. From these libraries, one can extract reflection spectra of tar, bricks,
coal, and a variety of typical overburden materials typically seen in a coal-mining area, as well as create synthetic
spectra by combining the spectra of individual materials. Figure 14.2.3 shows typical-spectral signatures of clear
water, turbid water, coal, healthy green vegetation, stressed vegetation with reduced water content, and dry,
brownish-sandy soil.
'
Examining Figure 14.2.3, it is clear that whereas calm-clear water and clean-coal outcrops have relatively low
reflectance across several wavelengths, the reflectance spectra of healthy green vegetation shows quite a dramatic
change in reflectance across wavelengths. For green vegetation, the sudden jump in reflectance, from low in the red
region to very high in the near-infrared region, is very characteristic. The spectral position of this sudden jump
(known as the red edge) and the continuous high reflectance in the near-infrared region (known as the near-
infrared plateau) are diagnostic for detecting the type and health of the vegetation. In a coal-mining area, it is a
common observation that vegetation near the polluted mining areas are stressed, showing a shift in the red edge.
Drier vegetation shows a shift in elevation of the infrared plateau and a decrease in the strengths of the absorption
peaks in the shortwave infrared regions compared with greener healthier vegetation from the same plant outside the
areas affected by mining and fire.