Graphics Programs Reference
In-Depth Information
It is advantageous to shoot at 16 bits/channel if you can afford to support
the increased memory and storage requirements because manipulations made
to images can be “destructive,” which is something you'll learn about in the
next section. High dynamic range (HDR) images have even higher bit depths at
32 bits/channel (see Chapter 14, “Merging Photos”).
data versus detail
Just because you shoot a 24-bit photo doesn't mean you have taken advantage of
the full tonal range stored in the image. In other words, you might be “paying”
for the data even if you are not filling all of it with detail. Histograms provide a
way to take a look at how data is distributed across the tonal range.
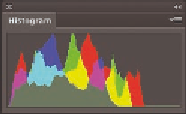
Figure 3.25 shows a typical histogram. Thin vertical bars are arranged in a
statistical representation of where pixels fall across the tonal range, from shad-
ows on the left through mid-tones to highlights (bright areas) on the right. The
histogram is color coded to show the contribution from each channel and its
complements. The gray graph represents the sum total of all the channels.
Shadows
Mid-tones Highlights
FIGURe 3.25
Using
the Histogram panel to see
how pixels are distributed
This particular histogram tells us that the brightest highlights aren't as bright as
they should be. The peaks in the shadows show that this image is also dark. After
the image is manipulated by increasing brightness and adjusting the highlight
input level (which you'll learn more about in Chapter 11, “Adjusting and Filtering”),
the histogram shows a better distribution across the tonal range (see Figure 3.26).
After the image is manipulated, the number of pixels hasn't changed so the
amount of data hasn't changed either. However, tiny gaps in the histogram show
that some of the initial detail has been irretrievably lost. This emphasizes the
fact that there is a difference between data and detail.