Biology Reference
In-Depth Information
40
20
10
8
6
4
2
1
.001
.003
.005
.02
.04
.1
.3
.5
.002
.004
.01
.03
.05
.2
.4
P
(k)
FIGURE 2.3
A linear regression draws a line of best fit through a scatterplot of the data.
1.0
0.9
0.8
0.7
0.6
0.5
0.4
0.3
0.2
0.1
0.0
-5
-4
-3
-2
-1
0
1
2
3
4
5
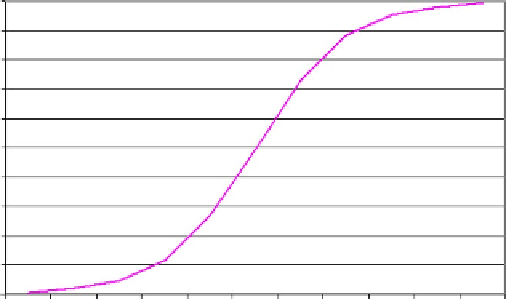
FIGURE 2.4
The logistic function is a smooth curve.