Biology Reference
In-Depth Information
cwIO
divIVA
dltA
ezrA
fapR
ftsA
ftsE
ftsH
ftsW
gcaD
ggaA
glmS
glpQ
gtaB
hit
htrB
iseA
liaI
lytE
lytF
lytG
mraZ
mreB
mreBH
murAA
murAB
murC
murE
murQ
nagP
pbpA
pbpD
pbpG
pbpH
pbpI
pgdS
pgsA
phoA
phoB
phoD
phoP
plsC
pssA
pstS
recU
tagA
tagC
tagD
tagG
thdF
topA
tuaA
yjeA
ykfA
ykoL
ylmB
yqfF
yqgC
yqgS
yqiH
ysmB
ythP
vttP
359
162
247
206
162
254
479
333
129
106
38
172
673
39
69
33
98
0
75
0
60
327
345
53
403
32
104
116
156
73
169
436
0
95
25
151
185
1947
1738
583
32
87
98
4270
0
95
0
269
244
34
110
584
33
0
281
0
41
74
66
49
120
105
32
Colour legend:
0
0.05 0.1 0.15 0.2 0.25 0.3 0.35 0.4 0.45
0.5 0.55 0.6 0.65 0.7 0.75 0.8 0.85 0.9 0.95
1
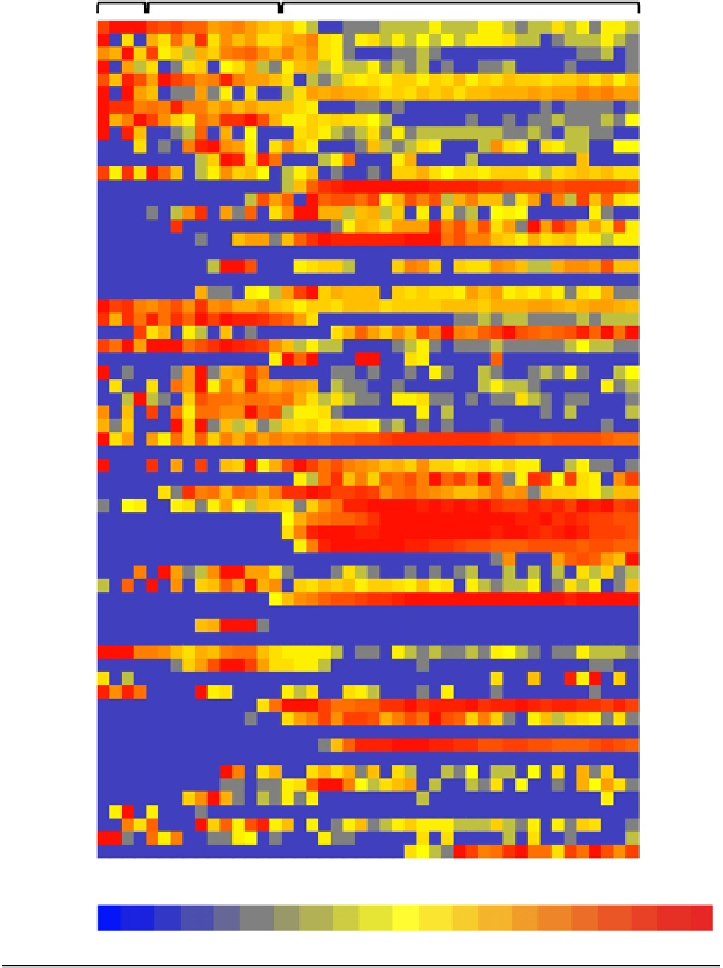
FIGURE 1.4
Expression profiles of promoter fusions visualized in heat map format. The expression profiles
of 63 randomly selected promoter gfpmut3 fusions generated by Heat Map Generator (
http://
bioinf.gen.tcd.ie/HMG
)
. The values of each profile are presented on a 0-1 scale, normalized
to the maximum promoter activity value (P
act
max) of each fusion which is given at the right
hand side of the map. The colour legend signifies the percentage of P
act
max represented by
each colour. By combining the colour values with the P
act
max values, the strengths of
individual promoters at different points of the growth cycle (e.g. lag, exponential growth,
phosphate limitation) can be compared.