Biology Reference
In-Depth Information
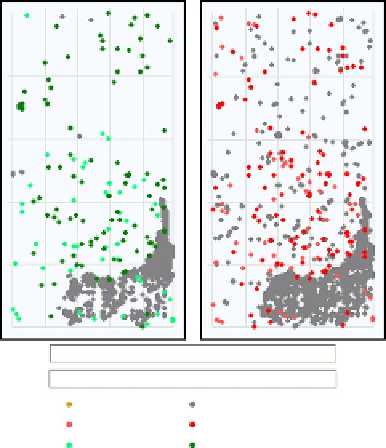
Spatial distribution of all outliers on the array
532 rows
85 columns
# FeatureNonUnif (red or green) = 145(0.33%)
# GeneNonUnif (red or green) = 143 (0.340 %)
BG Nonuniform
BG population
Red feature population
Green feature population
Red feature nonuniform
Green feature nonuniform
FIGURE 6.2
Graphs from an example QC Report for two-colour gene expression microarrays generated by
the Feature Extraction software (Agilent Technologies). The two plots show the spatial
distribution of all feature and background (BG) outliers for the green and red channels,
respectively. The number (and percentage) of features/genes that are non-uniformity outliers
in either the green or red channel are shown below the plots.
misleading expression signals such as the antisense signal, that can arise from the
reverse transcriptase activity, need to be assessed specifically.
The second issue relating to quality control concerns the biological consistency of
the data. In a typical set of microarray experiments in which a number of biological
conditions are tested, several biological replicates are used for each condition. This
allows one to verify that their expression signal is more similar within than between
conditions. For this purpose, the relationships between samples will typically be
summarized into a hierarchical clustering tree (see paragraph on clustering below).
If replicates from two or more biological conditions seem to mix consistently, one
needs to ask whether this was expected or if it is indicative of a sub-optimal exper-
imental set-up: the applied stress could have been too gentle, for instance. Some-
times, separate groups appear clearly, but some hybridizations seem to be in the
wrong group: this may indicate a mislabelling of the samples. Finally, one or a
few clear outlier samples may be visible which could indicate an uncontrolled var-
iability. In which case, a closer examination of the genes exhibiting the higher fold