Biology Reference
In-Depth Information
4. Use the concentrations of cDNA (ng/ml) and Cy3 (pmol/ml) to determine the labelling
efficiency as follows:
Cy3 concentration/cDNA concentration1000¼pmol Cy3 per mg cDNA
Step 6. Bioanalyzer Quality Control of cDNA
1. Transfer 250 ng cDNA to a microcentrifuge tube. Store the remainder of your
sample on ice or at 20
C.
2. Analyse the samples using a Bioanalyzer (Agilent).
3. Verify that all samples meet the following requirement for acceptance:
Median size 400 bp when compared to a DNA ladder.
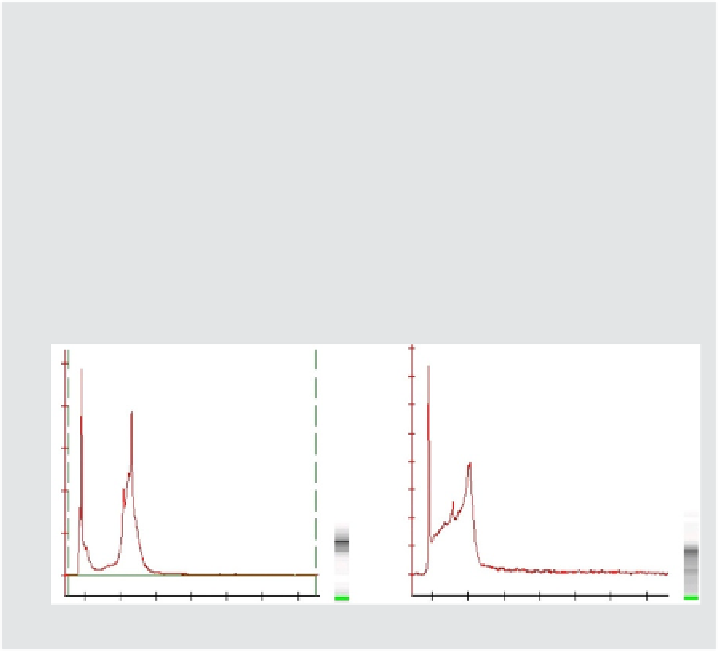
Look similar to the examples of good cDNA sample traces displayed below.
4. Samples exhibiting degradation should not be carried through hybridization
because there is an unacceptable risk of poor results.
FIGURE
Example traces (Agilent Bioanalyzer) showing good quality cDNA.
16
25
14
12
20
10
15
8
6
10
4
5
2
0
0
20
30
40
50
60
70
80 [s]
20
30
40
50
60
70
80 [s]
Time (s)
Time (s)
the dye-labelled cDNA is purified and quality controlled to monitor the performance
of the labelling procedure. Purification of cDNA is usually performed with spin-
column based kits, for example, the CyScribe GFX Purification Kit (GE Healthcare).
In the next step, the cDNA yield and labelling efficiency are assessed using a
NanoDrop spectrophotometer (Thermo Scientific) following the manufacturer's
instructions. As a further quality parameter, the size distribution of the cDNA sam-
ples can be analysed (see protocol below). If the quality measures do not match the
thresholds specified in the employed protocol or established during protocol devel-
opment, the affected cDNA samples should not be subjected to hybridization.
It is essential to note that reverse transcriptase generates spurious second-strand
cDNA due to its DNA-dependent polymerase activity (
Ruprecht
et al.
, 1973
). As
second-strand synthesis leads to antisense artefacts as well biases in the quantifica-
tion of expression levels, it is important to inhibit the DNA-dependent polymerase
activity of the reverse transcriptase with actinomycin D, as first shown by
Perocchi
et al.
(2007)
for the example of yeast tiling array experiments. As an alternative