Biology Reference
In-Depth Information
A
B
−EIC 259>97
−EIC 259>97
325
350
375
400
425
450
475
500
525
550
575
600
625
325
350
375
400
425
450
475
500
525
550
575
600
625
Run time
Run time
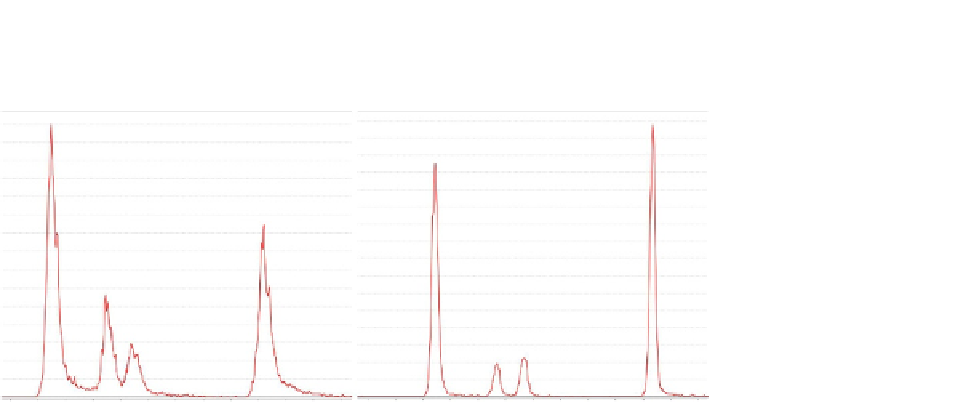
FIGURE 5.2
The separation of hexose phosphate isomers (from left to right: glucose-6-phosphate,
fructose-6-phosphate, glucose-1-phosphate, fructose-1-phosphate) on a used column (A) is
severely reduced compared to a new column (B).
The width of the chromatographic peaks with this gradient can be as short as 10 s.
Thus, a data acquisition rate of more than 2 scans/(s compound) is required
for reliable peak integration. If using an MS/MS-type mass spectrometer, the
gradient may need to be split into several time segments, depending on the
required time per scan and the number of target metabolites.
Check the chromatographic separation by injecting 10
M
standard mixture. The most sensitive test is the separation and peak shape of
sugar-phosphate isomers (
Figure 5.2
).
Prepare samples in water
- Low concentrations of organic solvents can be tolerated, that is,
m
Lofa5-
m
5%
<
methanol and
1% other organic solvents. Higher organic solvent
concentrations will interfere with the retention and separation of analytes.
If analytes in the standard mixture have a concentration of 100
<
M in 50%
methanol, a 1:20 dilution of this mixture can be used straight away.
- High salt concentrations can affect separation and peak shapes.
- Typically, dissolve a dried extract obtained from a 1-mL culture of OD
600
1.0
(
m
L water.
Typical injection volumes are between 2 and 20
50 mg
DryWeight
) in 100
m
m
L.
5.2
Detection by ESI-MS/MS
Prior to first use, optimize the ESI parameters. To this end, provide a
continuous flow of 50
L min
1
of 100
m
m
M of a relevant metabolite