Geography Reference
In-Depth Information
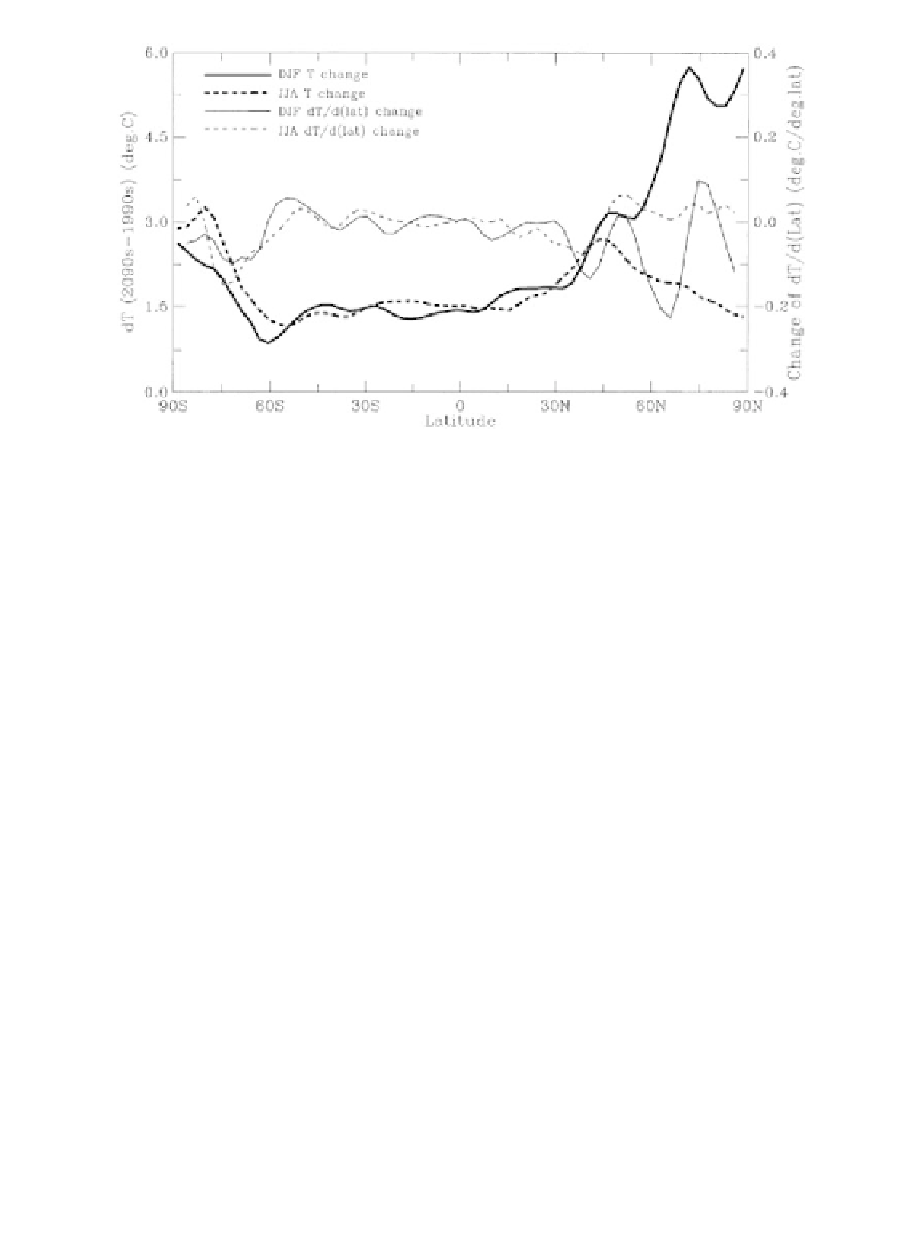
Fig. 10.24
Latitudinal distribution of predicted changes of the zonally averaged surface air temper-
ature from the 1990s to the 2090s for Northern Hemisphere winter (DJF: heavy solid
curve) and Northern Hemisphere summer (JJA: heavy dashed curve) for a scenario with
approximate doubling of the atmospheric carbon dioxide concentration. Also shown as
light curves (right side ordinate) are changes (2090s minus 1990s) of the pole to equator
temperature gradient in
◦
C per degree of latitude. (After Dai et al., 2001.)
The model has been used to assess likely responses of the climate system to the
radiative forcing by increased greenhouse gas concentrations. The latitudinal dis-
tribution of zonally averaged surface temperature change predicted for the end of
the 21st century under a scenario of approximate doubling of atmospheric carbon
dioxide concentrations (“business as usual”) is shown in Fig. 10.24. In common
with other climate models, the CSM result suggests that the largest temperature
changes will occur at high latitudes in the Northern Hemisphere winter, accompa-
nied by a substantial reduction of sea ice. A global average warming of 1.9
◦
Cby
the end of the century is predicted for the business as usual scenario. Because of the
complexity of the physical processes involved, many uncertainties remain in such
model predictions of climate change. Nevertheless, most climate scientists agree
that increased carbon dioxide concentrations will lead to a warmer surface climate.
PROBLEMS
10.1.
Starting with the isobaric version of the thermodynamic energy equation
(2.42), derive the log-pressure version (10.5).
10.2.
Show that in the σ -coordinate system a mass element ρ
0
dxdydz takes the
form -g
−
1
p
s
dxdydσ.