Geography Reference
In-Depth Information
zonal-mean heating, will be positive. For a
dry
atmosphere in which eddy diabatic
processes are limited to radiation and diffusion R
, the diabatic production of
eddy available potential energy should be negative because the thermal radiation
emitted to space from the atmosphere increases with increasing temperature and
thus tends to reduce horizontal temperature contrasts in the atmosphere. For the
earth's atmosphere, however, the presence of clouds and precipitation greatly alters
the distribution of R
. Present estimates (see Fig. 10.13) s
ug
gest that in the Northern
Hemisphere R
is positive and nearly half as large as R. Thus, diabatic heating
generates both zonal-mean and eddy available potential energy.
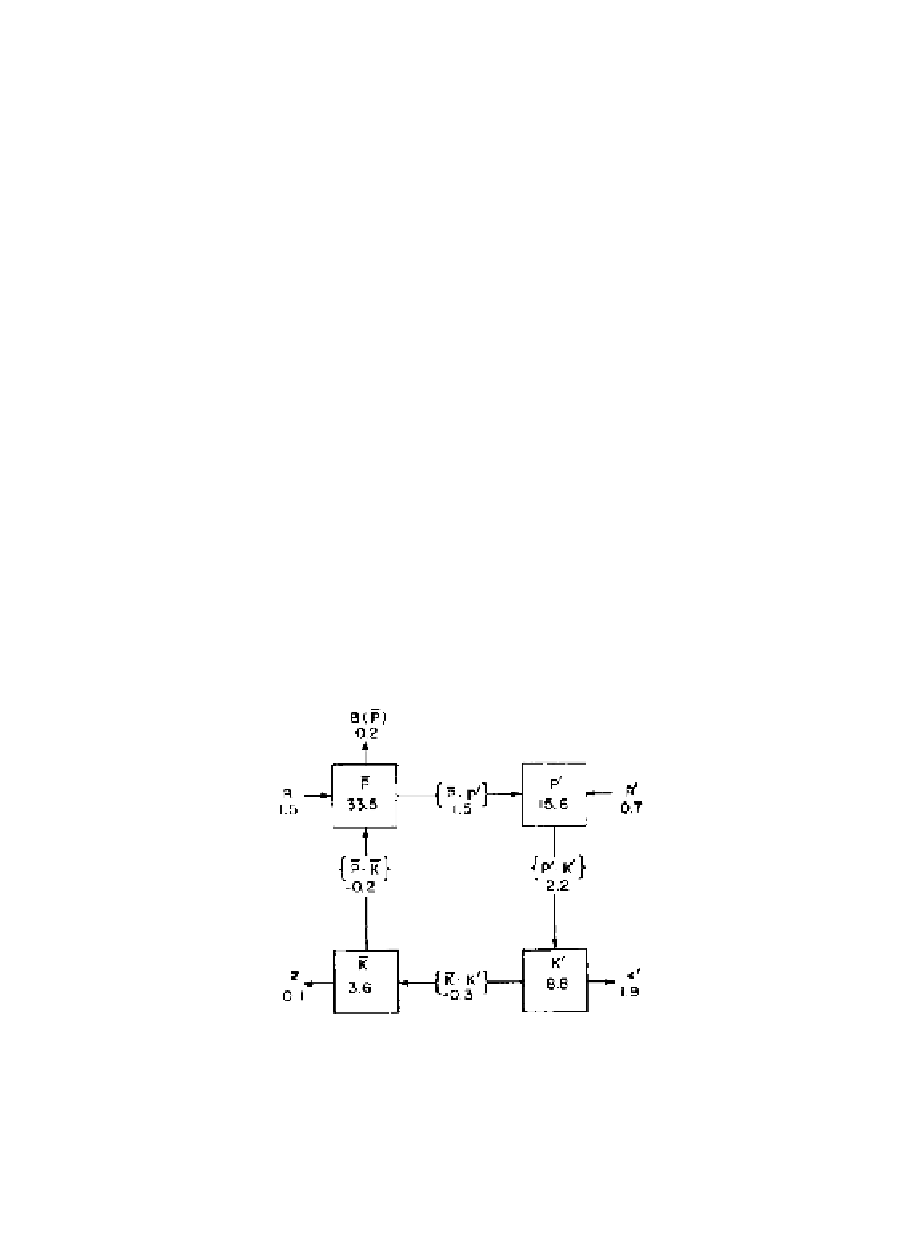
The equations (10.59)-(10.62) together provide a complete description of the
quasi-geostrophic energy cycle from the conventional Eulerian mean point of view.
The content of these equations is summarized by means of the four-box diagram of
Fig. 10.13. In this diagram the squares represent reservoirs of energy and the arrows
indicate sources, sinks, and conversions. The observed direction of the conversion
terms in the troposphere for the Northern Hemisphere annual mean is indicated by
arrows. It should be emphasized that the direction of the various conversions cannot
be theoretically deduced by reference to the energy equations alone. It also should
be emphasized that the conversion terms given here are a result of the particular
type of zonal average model used. The analogous energy equations for the TEM
equations have rather different conversions. Thus, the energy transformations given
in the present analysis should not be regarded as fundamental properties of the
atmosphere, but rather as properties of the Eulerian mean system.
Nevertheless, because the conventional Eulerian mean model is generally used
as a basis for the study of baroclinic waves, the four-box energy diagram presented
Fig. 10.13
The observed mean energy cycle for the Northern Hemisphere. Numbers in squares are
energy amounts in units of
10
5
Jm
−
2
. Numbers next to arrows are energy transformation
rates in units of W m
−
2
. B(p) represents a net energy flux into the Southern Hemisphere.
Other symbols are defined in the text. (Adapted from Oort and Peixoto, 1974.)