Geography Reference
In-Depth Information
0
250
500
750
1000
W
E
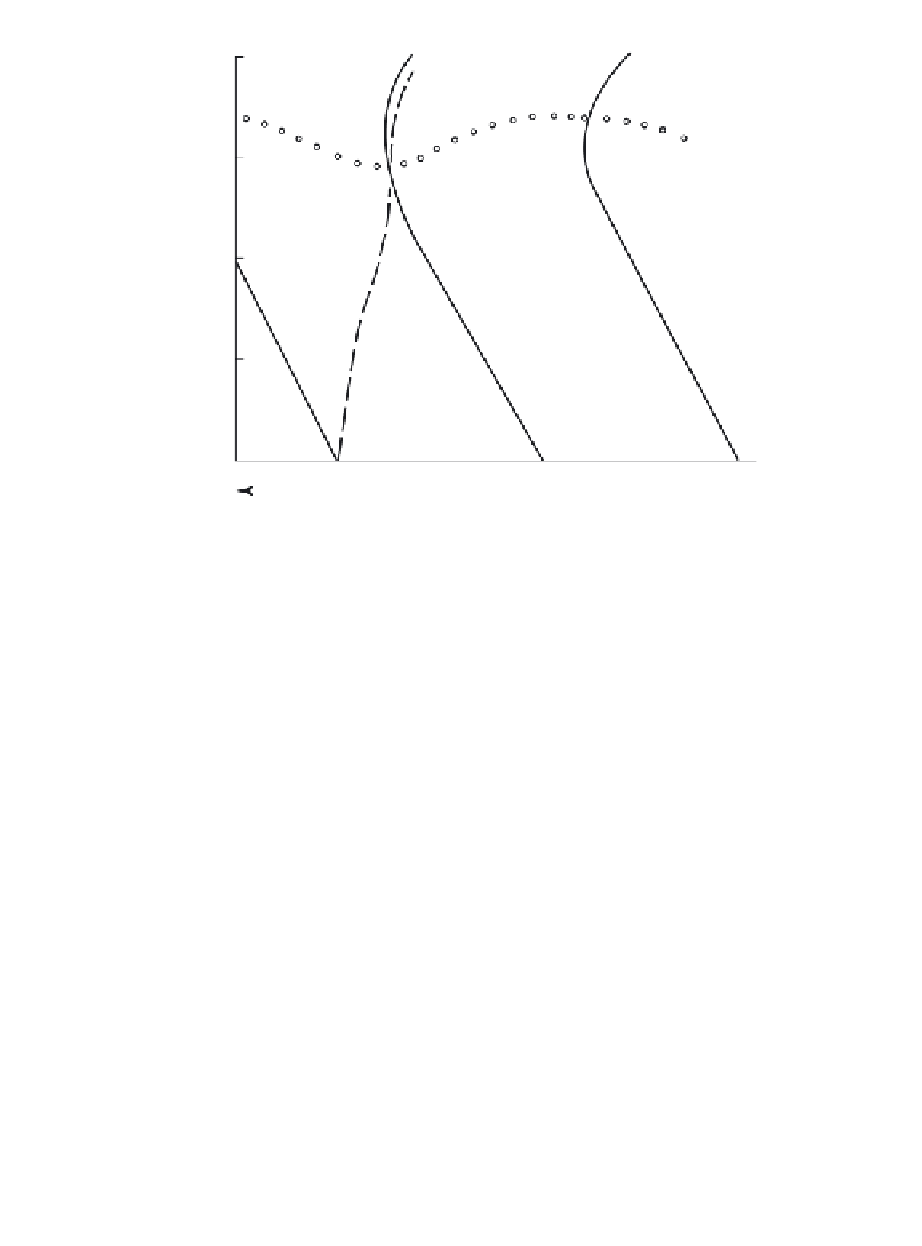
Fig. 6.6
West-east cross section through a developing baroclinic wave. Solid lines are trough and
ridge axes; dashed lines are axes of temperature extrema; the chain of open circles denotes
the tropopause.
because meteorological measurements are generally referred to constant pressure
surfaces and because the dynamical equations are somewhat simpler in isobaric
coordinates than in height coordinates. Thus, use of the isobaric coordinate system
simplifies the development of approximate prognostic and diagnostic equations.
6.2.1
Scale Analysis in Isobaric Coordinates
The dynamical equations in isobaric coordinates were developed in Section 3.1 and,
for reference, are repeated here. The horizontal momentum equation, the hydro-
static equation, the continuity equation, and the thermodynamic energy equation
may be expressed as
D
V
Dt
+
×
=−
∇
f
k
V
(6.1)
RT
p
∂
∂p
=−
α
=−
(6.2)
∂ω
∂p
=
∇·
V
+
0
(6.3)
∂
∂t
+
T
V
·∇
−
S
p
ω
=
J/c
p
(6.4)