Geography Reference
In-Depth Information
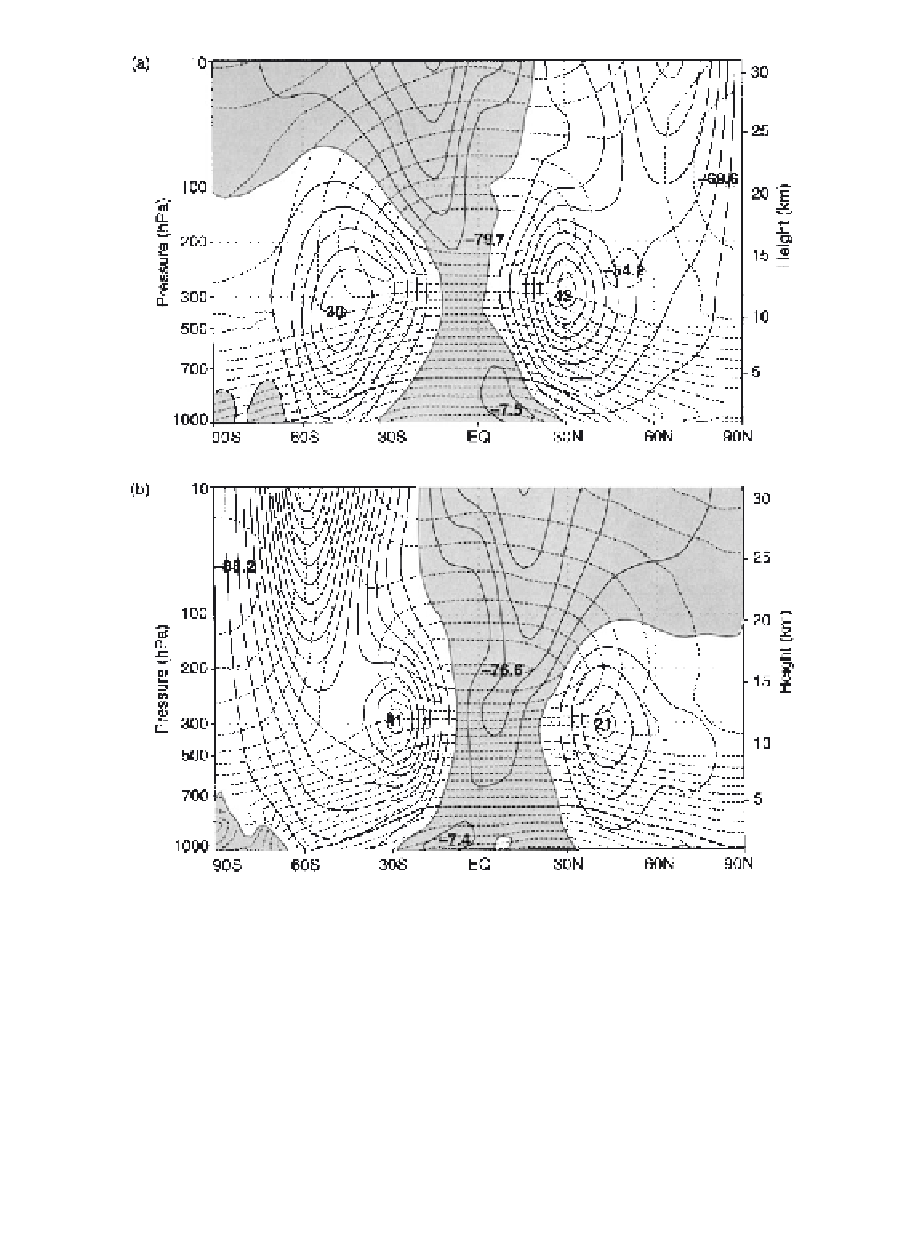
Fig. 6.1
Meridional cross sections of longitudinally and time-averaged zonal wind (solid contours,
interval of m s
−
1
) and temperature (dashed contours, interval of 5 K) for December-February
(a) and June-August (b). Easterly winds are shaded and 0˚ C isotherm is darkened. Wind max-
ima shown in m s
−
1
, temperature minima shown in ˚C. (Based on NCEP/NCAR reanalyses;
after Wallace, 2003.)
(3.30) to a high degree of accuracy, the seasonal cycle in zonal wind speeds is
similar to that of the meridional temperature gradient. In the Northern Hemisphere
the maximum zonal wind speed in the winter is twice as large as in the summer,
whereas in the Southern Hemisphere the difference between winter and summer