Information Technology Reference
In-Depth Information
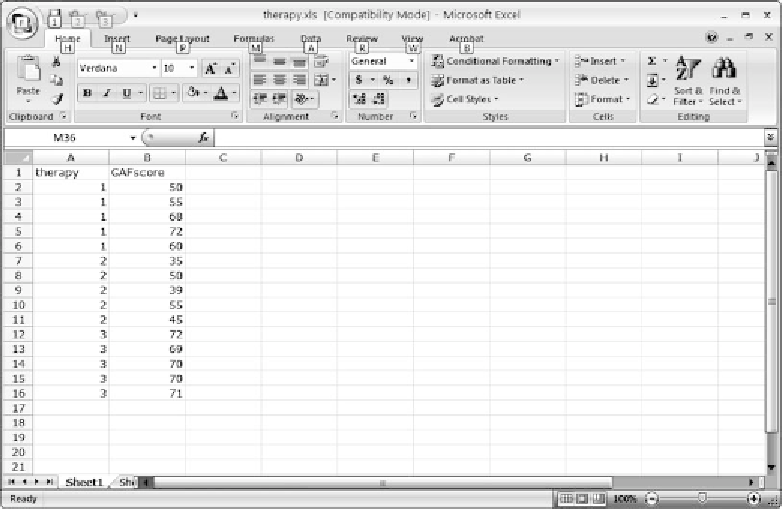
Figure 5.21
The Excel spreadsheet with the data.
the Brown-Forsythe test as well as the more conservative Welch test both
indicated that the mean differences are statistically significant despite vio-
lating the homogeneity of variance assumption.
5.6 SAS APPLICATIONS: ASSUMPTION VIOLATION
DETECTION AND SOLUTION
5.6.1 SAS DATA SCREENING
As recommended in Appendix B, we have entered our data into an Excel
spreadsheet and will import the data set into an
SAS Enterprise Guide
project. The Excel spreadsheet is shown in Figure 5.21. Import data from
Excel as described in Appendix B. The result of this operation is shown in
Figure 5.22.
We will first obtain the frequencies for the occurrence of each value.
From the main menu select
Describe
➜
One-Way Frequencies
to reach
the screen shown in Figure 5.23. The screen opens on the
Task Roles
tab,
which is highlighted at the top of the navigation panel in the far left portion
of the screen. Highlight
GAFscore
in the
Variables
panel and using one
of the following two techniques place it under
Analysis variables
in the
Roles
panel: (a) drag it to the icon for
Analysis variables
; (b) click on
the right facing arrow between the two main panels and select
Analysis