Information Technology Reference
In-Depth Information
1000
500
0
Score
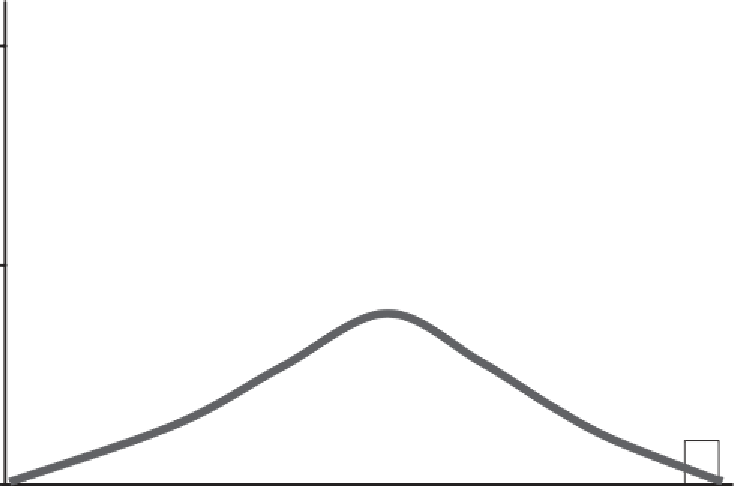
Figure 5.5
A platykurtic distribution (negative kurtosis).
middle, producing a peaked look. Conversely, Figure 5.5 displays a
platykurtic
distribution, which has a flatter, more evenly distributed look
than the normal curve.
5.3.2 SITUATIONS PRODUCING VIOLATIONS OF THE ASSUMPTION
OF NORMALITY OF ERRORS
ANOVA assumes that the residual error associated with the
Y
i
scores is
normally distributed. However, in practice, we often encounter dependent
variables that are not perfectly normal in shape. In fact, much of the time
our variables rarely take on the idealized shape depicted in Figure 5.1, but
instead reflect the irregularities (lack of symmetry) caused by sampling
variability. This variability is particularly evident when sample sizes are
small, that is, less than 8-12 (Keppel & Wickens, 2004; Tabachnick &
Fidell, 2007), or when outliers are present in the distribution.
Outliers
are cases with extreme or unusual values on a particular vari-
able, possibly indicating an exciting serendipitous discovery, but more
likely indicative of experimental error (e.g., coding error, participant fail-
ure to follow instructions, uncooperative children or rats, fatigue). Out-
liers should be eliminated unless the researcher deems them to be truly a
small part of the population under study.
Detection of outliers can be readily accomplished with computer pro-
grams such as SPSS or SAS by converting the values of a variable to