Information Technology Reference
In-Depth Information
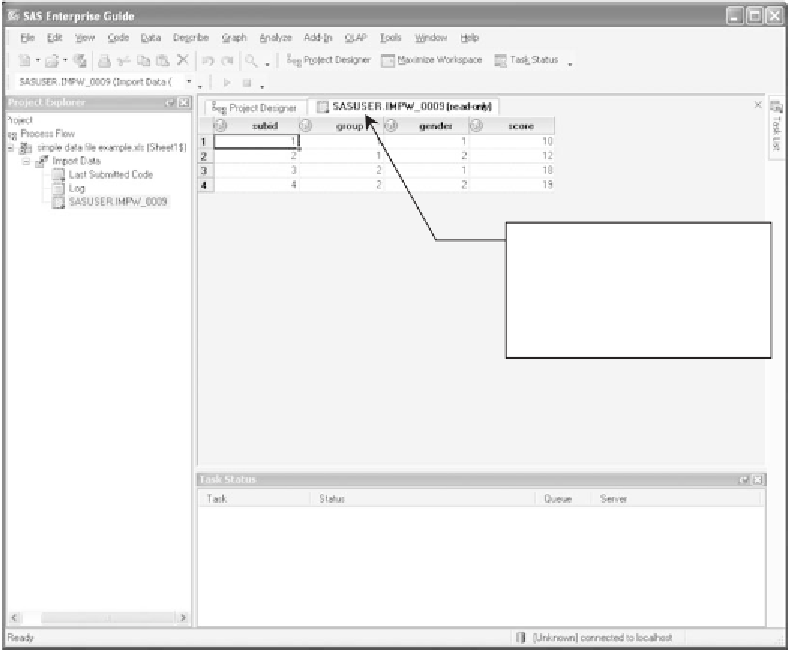
Note that there is now another tab
next to Project Designer. This is the
tab for the data file. The data file
tab is darker, meaning that it is now
active and displaying the data file.
Figure B12
SAS Enterprise Guide
view of the data file.
tab labeled
SASUSER.IMPW_0009(read_only)
, and that the data file is
displayed. The name of the tab indicates that the data are in SAS format
(
SASUSER
means “SAS user”) and were imported from an outside file.
The number 0009 means that it is the ninth project that we worked on since
SAS was initially opened in this work session (your number will likely be
different).
We mentioned that SAS does its statistical analysis inside a project. To
see the context and flow, you can click the tab named
Project Designer
above the grid of the window shown in Figure B13. The
Process Flow
diagram is shown in Figure B13.
The
Process Flow
isaflowchartonagridbackgroundshowingthe
stages you have completed in icon and arrow format. You can see that we
started with an Excel spreadsheet named
Sample Data.xls
, which, when
we imported it, gave rise to an SAS data file named
SASUSER 1
. Note that
in either view (
SASUSER
or
Project Designer
) the main
SAS Enterprise
Guide
menu at the very top of the screen is available. It is from this menu
that you would select the statistical procedure you want to use.