Information Technology Reference
In-Depth Information
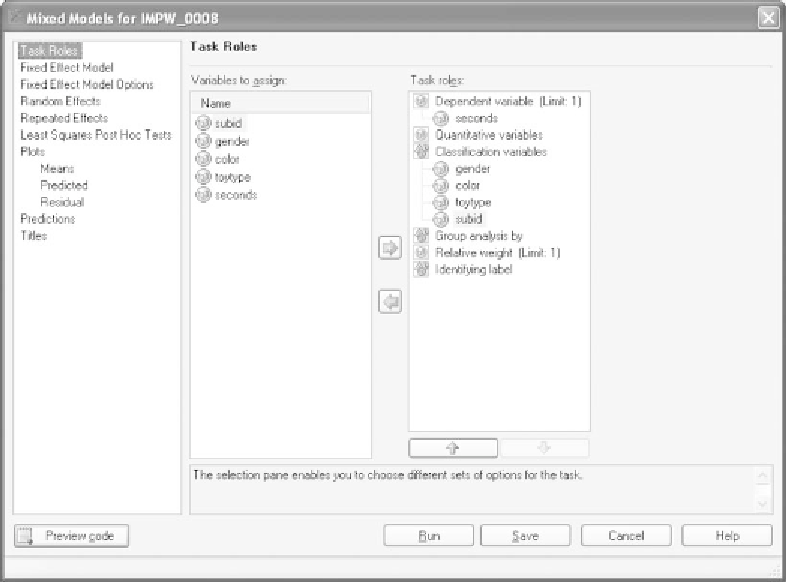
Figure 15.23
The
Task Roles
have been specified.
in univariate or stacked mode as explained in Section 10.15.2, and is
similar to those we have seen for the examples in Chapters 12-14. The
gender
,
color
, and
toytype
independent variables show the codes for the
levels corresponding to the
seconds
dependent variable (the time the child
played with the toys) for each case. Note that by examining the data file
we can determine that
gender
is a between-subjects variable because each
subject is associated with only one level of that variable. By the same
reasoning, we can determine that
color and toytype
are within-subjects
variables because each subject has values on the dependent variable for
all levels of those two variables. To illustrate how to read the data file, the
case identified as
subid 1
whose record is shown in Row 2 (the first row
of data) is coded as
gender 1
(female). That child played with toys coded
as
color 1
(yellow) and
toytype 1
(hands-on) for five seconds. As another
example, the case identified as
subid 6
whose record is shown in Row 25
is coded as
gender 2
(male). That child played with toys coded as
color 2
(blue) and
toytype 2
(pretend) for seven seconds.
15.8.2 STRUCTURING THE DATA ANALYSIS
Import the data file from Excel into a new SAS project. Then from the
main menu select
Analyze
➜
ANOVA
➜
Mixed Models
.Thewindow