Information Technology Reference
In-Depth Information
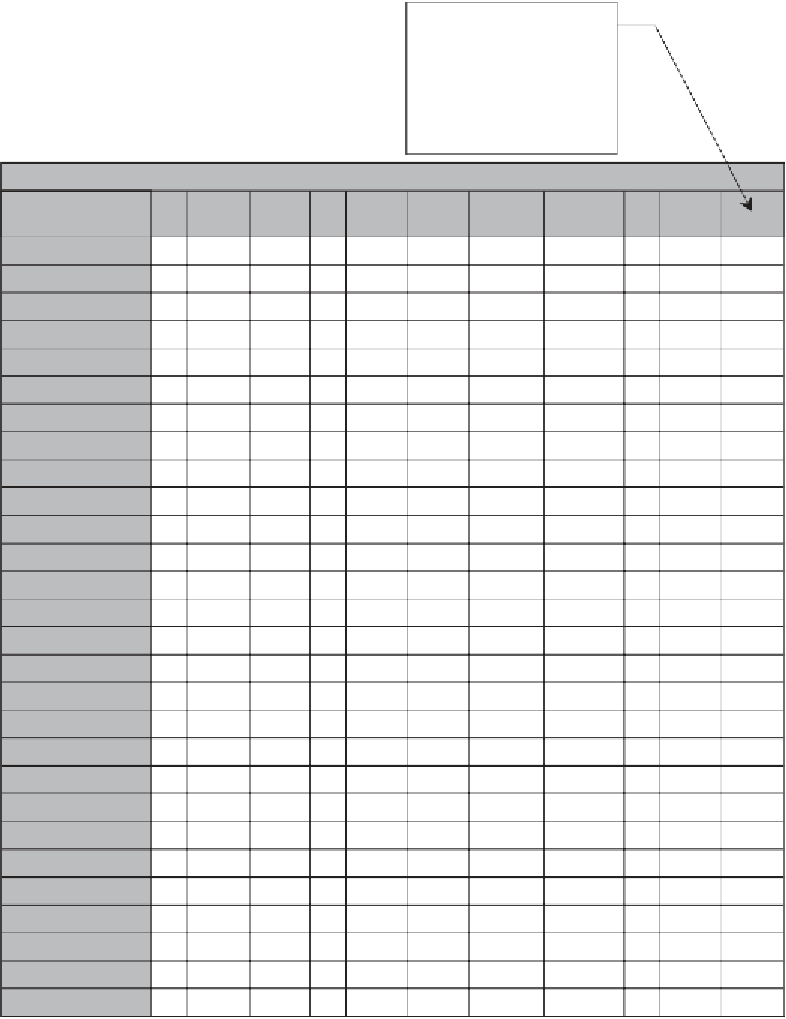
This Table presents the
unadjusted
p
-value. The
Bonferroni adjustment (not
shown) can be calculated by
multiplying the unadjusted
p
-value by 28 (the number
of all pairwise comparisons).
Differences of Least Squares Means
Standard
Error
Effect
age
∗
gender
∗
attract
age
∗
gender
∗
attract
age
∗
gender
∗
attract
age
∗
gender
∗
attract
age
∗
gender
∗
attract
age
age
gender
attract
age
gender
attract
Estimate
DF
t Value
Pr
>
ltl
1
1
1
1
1
1
1
1
1
1
1
1
1
1
1
1
1
1
1
1
1
1
1
1
1
1
1
1
1
1
1
2
2
2
−1.4000
0.3536
0.5196
0.5196
0.5196
0.5196
0.5196
0.5196
0.5196
0.5196
0.5196
0.5196
0.5196
0.5196
16
−3.96
0.0011
1
2.2000
1.2000
16
16
16
16
16
16
16
16
16
16
16
16
16
16
16
16
16
16
16
16
16
16
16
16
16
16
16
4.23
2.31
0.0006
0.0346
2
1
1
2
2
1
1
1
−
3.0000
−
5.77
<
.0001
2
−
2.8000
−
5.39
<
.0001
∗
gender
∗
attract
1.92
1
1
2
2
2
2
1
1.0000
0.0723
0.0014
age
∗
gender
∗
attract
−
2.0000
−
3.85
2
2
age
∗
gender
∗
attract
6.93
5.00
<
.0001
2
2
2
1
1
1
3.6000
2.6000
age
∗
gender
∗
attract
2
2
0.0001
0.0072
0.0160
0.0003
0.2652
0.0121
age
attract
age
∗
gender
∗
attract
age
∗
gender
∗
attract
age
∗
gender
∗
attract
age
∗
gender
∗
attract
age
∗
gender
∗
attract
age
∗
gender
∗
attract
age
∗
gender
∗
−
1.6000
−
3.08
2
2
2
1
1
1
−
1.4000
−
2.69
2
2
2
2
4.62
1
1
2
2
1
2.4000
2
2
−0.6000
−1.0000
−5.2000
−1.15
1
1
1
1
1
2
2
2
1
1
2
2
0.3536
−2.83
1
1
2
1
1
1
0.5196
0.5196
0.5196
0.5196
0.5196
0.5196
0.5196
0.5196
0.3536
0.5196
0.5196
0.5196
0.5196
0.5196
−10.01
<.0001
<
2
2
2
2
−
5.0000
−
9.62
.0001
∗
gender
∗
attract
−
1.2000
−
2.31
2
2
2
2
2
2
1
1
2
2
1
0.0346
age
∗
gender
∗
attract
−
4.2000
−
8.08
<
.0001
2
age
∗
gender
∗
attract
1
1
1
1
2
2
2
2
2
1
1
1
−
4.2000
−
8.08
<
.0001
age
∗
gender
∗
attract
−
4.0000
−
7.70
<
.0001
2
2
2
2
age
∗
gender
∗
attract
−
0.2000
−
0.38
2
2
1
0.7054
age
attract
age
∗
gender
∗
attract
age
∗
gender
∗
attract
age
∗
gender
∗
−
3.2000
−
6.16
<
.0001
2
−
0.2000
2
2
2
2
2
2
1
1
1
1
2
1
2
0.57
7.70
1.92
7.31
1.54
0.5795
<
.0001
1
1
2
2
2
2
2
2
2
2
2
2
1
4.0000
1.0000
3.8000
0.8000
attract
age
∗
gender
∗
attract
age
∗
gender
∗
attract
age
∗
gender
∗
2
0.0723
1
1
2
2
1
<
.0001
2
2
0.1432
∗
gender
∗
attract
−3.0
000
−
8.49
<
.0001
2
1
Figure 14.31
A portion of the output from the simple effects tests.