Information Technology Reference
In-Depth Information
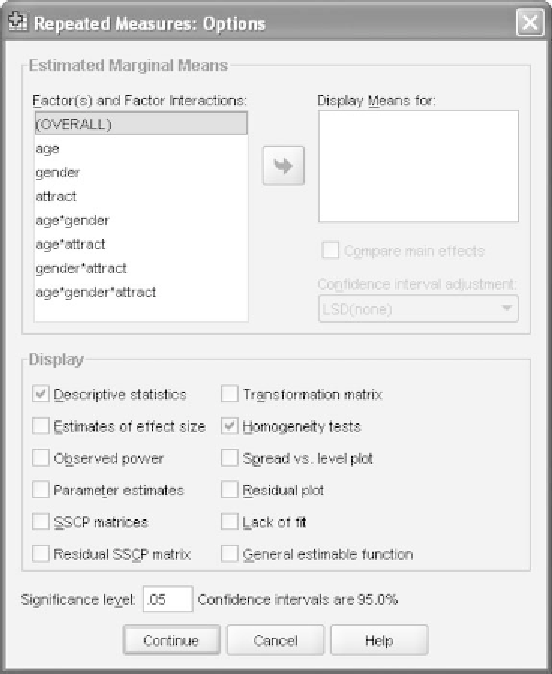
Figure 14.8
The
Options
dialog window.
Clicking
Define
in the
Define Factor(s)
window brings us to the
GLM
RepeatedMeasures
main dialog window of shown in Figure 14.6. We place
emotion
and
physical
in slots 1 and 2, respectively, of the
Within-Subjects
Variables
panel and
age
and
gender
in the panel for
Between-Subjects
Factor(s)
as shown in Figure 14.7.
Select the
Options
pushbutton to reach the
Options
dialog window.
With seven effects of interest here, we will wait until we perform the
post-ANOVA tests to determine for which effects we want to generate
tables of estimated marginal means. For this omnibus analysis, we simply
check
Descriptive statistics
and
Homogeneity tests
. This is shown in
Figure 14.8. Click
Continue
to return to the main dialog window.
In the
Plots
dialog window, click over
attract
to the
Horizontal Axis
because it is the within-subjects variable in that we generally want the
within-subjects variable on the
x
axis. Place
age
in the panel for
Separate
Plots;
this will result in one plot for the teenagers and a second plot for
the students in their middle twenties. Click over
gender
to the
Separate
Lines
panel; this will give us one line for females and another line for