Information Technology Reference
In-Depth Information
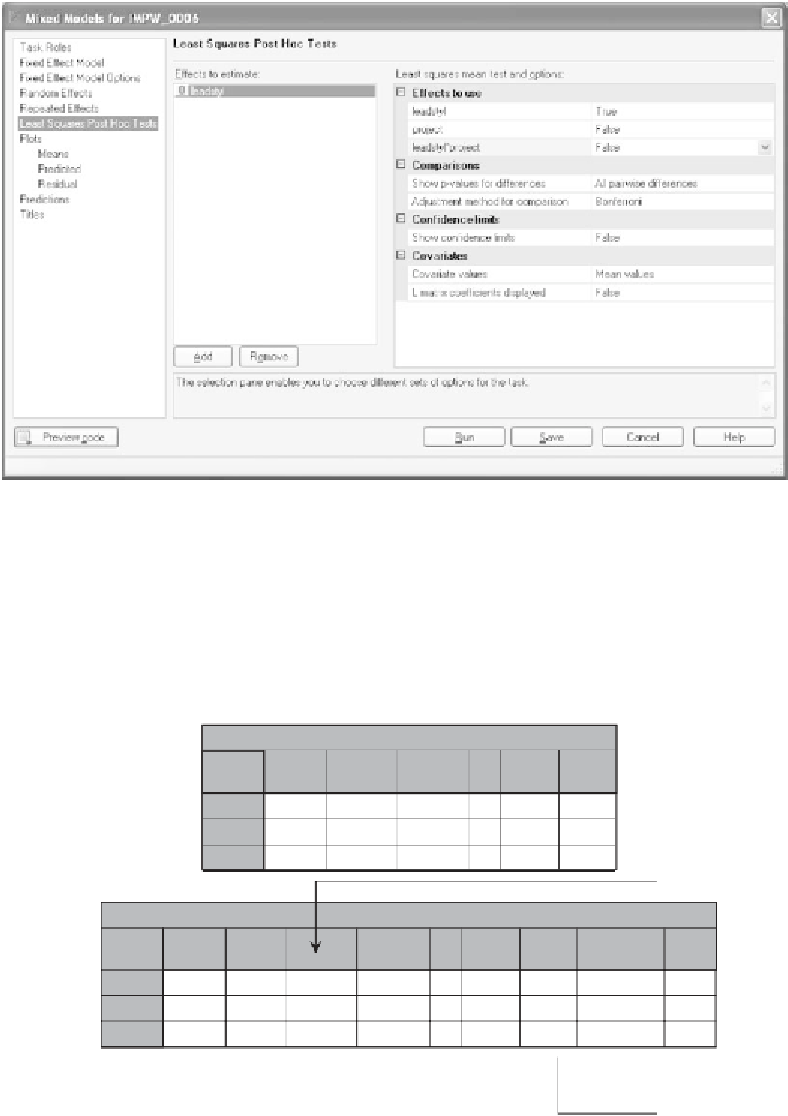
Figure 13.32
Specifying the post hoc tests.
13.14 SAS OUTPUT FROM THE POST HOC ANALYSIS
The pairwise mean comparisons together with the least squares means
are shown in Figure 13.33. As we indicated in discussing the SPSS output,
this main effect is completely subsumed by the interaction effect and will
therefore not be described.
Least Squares Means
Standard
Error
Effect
leadstyl
leadstyl
leadstyl
leadstyl
Estimate
DF
t Value
Pr > ltl
1
2
3
3.5000
6.6000
3.2000
0.3536
0.3536
0.3536
12
12
12
9.90
18.67
9.05
<.0001
<
.0001
<.0001
These are the mean
differences for the
different levels of
leadstyl.
Differences of Least Squares Means
Standard
Error
Effect
leadstyl
leadstyl
leadstyl
leadstyl
1
1
2
leadstyl
2
3
3
Estimate
DF
t Value
Pr > ltl
Adjustment
Adj P
−
3.1000
0.3000
3.4000
0.5000
0.5000
0.5000
12
12
12
−
6.20
0.60
6.80
<
.0001
0.5597
<.0001
Bonferroni
Bonferroni
Bonferroni
0.0001
1.0000
<.0001
This Table presents
both the
unadjusted
p
-value
and the Bonferroni
adjustment.
b
Figure 13.33
A portion of the output from the post hoc tests.