Information Technology Reference
In-Depth Information
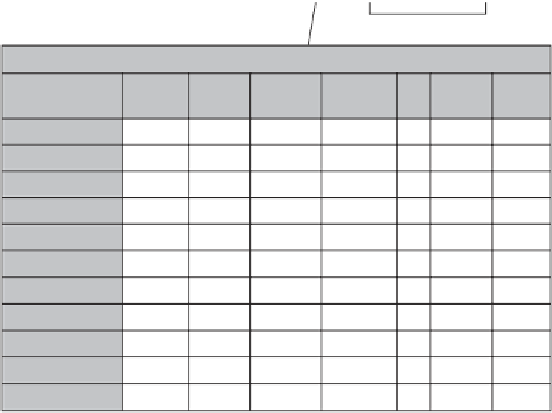
Cell means for all
eleven conditions.
Least Squares Means
Standard
Error
Effect
leadstyl
leadstyl
leadstyl
project
project
leadstyl
∗
project
leadstyl
∗
project
leadstyl
∗
project
leadstyl
∗
project
leadstyl
∗
project
leadstyl
∗
project
leadstyl
1
2
3
project
Estimate
DF
t Value
Pr
>
⏐
t
⏐
3.5000
6.6000
3.2000
5.3333
3.5333
6.0000
1.0000
6.4000
6.8000
3.6000
2.8000
12
12
12
12
12
12
12
12
12
12
12
<
.0001
<.0001
<.0001
<
0.3536
0.3536
0.3536
0.2236
0.2236
0.3873
0.3873
0.3873
0.3873
0.3873
0.3873
9.90
18.67
9.05
23.85
15.80
15.49
2.58
16.52
17.56
9.30
7.23
.0001
<.0001
<.0001
0.0240
<.0001
<.0001
<.0001
<
1
2
1
2
1
2
1
2
1
1
2
2
3
3
.0001
Figure 13.28
The least squares means for all of the effects.
These
p
-values suggest statistical
significances for both main
effects and interaction effect.
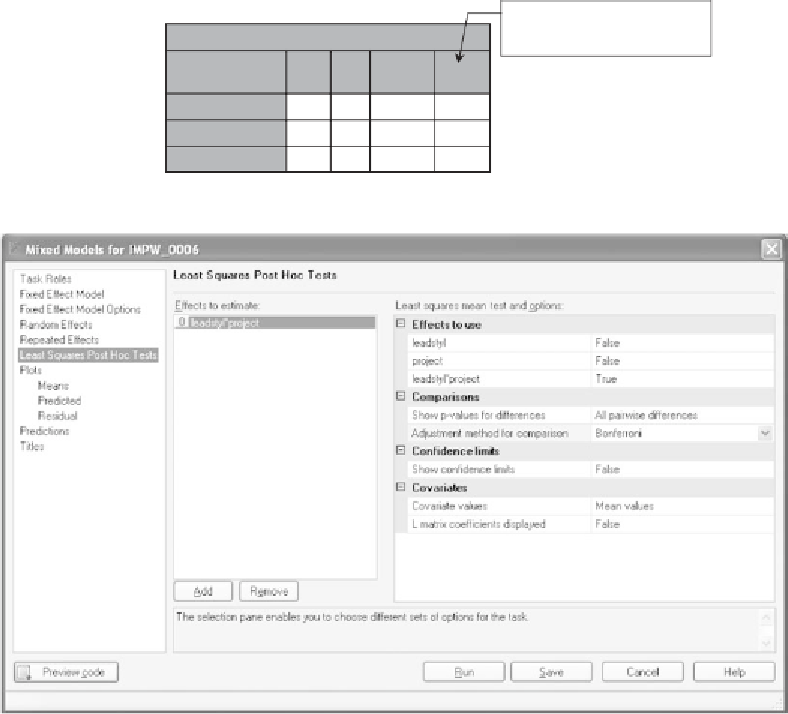
Type 3 Tests of Fixed Effects
Num
DF
Den
DF
Effect
leadstyl
project
leadstyl
∗
project
F Value
Pr
>
F
2
1
2
12
12
12
28.35
97.20
80.40
<
.0001
<.0001
<
.0001
Figure 13.29
The results of the ANOVA.
Figure 13.30
Specifying the simple effects tests.
386