Information Technology Reference
In-Depth Information
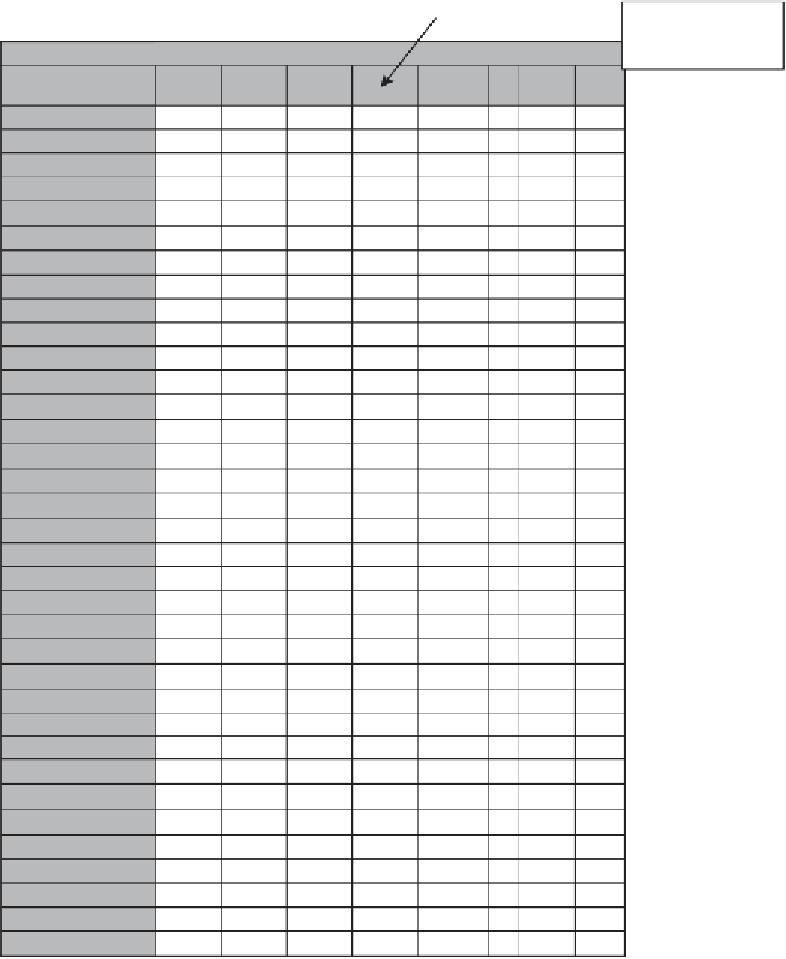
These are the means for
each cell of this 3
×
2
×
2
Least Squares Means
design.
Standard
Error
Pr
>
⏐
t
⏐
Effect
powcolor
powcolor
powcolor
granules
granules
boxcolor
boxcolor
powcolor*granules
powcolor*granules
powcolor*granules
powcolor*granules
powcolor*granules
powcolor*granules
powcolor*granules
powcolor*granules
powcolor*granules
powcolor*granules
powcolor*granules
powcolor*granules
granules*boxcolor
granules*boxcolor
granules*boxcolor
granules*boxcolor
powcol*granul*boxcol
powcol*granul*boxcol
powcol*granul*boxcol
powcol*granul*boxcol
powcol*granul*boxcol
powcol*granul*boxcol
powcol*granul*boxcol
powcol*granul*boxcol
powcol*granul*boxcol
powcol*granul*boxcol
powcol*granul*boxcol
powcol*granul*boxcol
powcolor
granules boxcolor Estimate
DF
t Value
1
2
3
4.1000
2.1583
4.9417
3.4500
4.0167
3.5944
3.8722
2.9500
5.2500
2.2667
2.0500
5.1333
4.7500
4.6000
3.6000
2.1500
2.1667
4.0333
5.8500
2.8222
4.0778
4.3667
3.6667
2.7000
3.2000
6.5000
4.0000
2.2000
2.3333
2.1000
2.0000
3.5667
6.7000
4.5000
5.0000
0.1629
0.1629
0.1629
0.1420
0.1420
0.1420
0.1420
0.2138
0.2138
0.2138
0.2138
0.2138
0.2138
0.2138
0.2138
0.2138
0.2138
0.2138
0.2138
0.1815
0.1815
0.1815
0.1815
0.2899
0.2889
0.2889
0.2889
0.2889
0.2889
0.2889
0.2889
0.2889
0.2889
0.2889
0.2889
10
10
10
5
5
5
5
10
10
10
10
10
10
10
10
10
10
10
10
5
5
5
5
10
10
10
10
10
10
10
10
10
10
10
10
25.16
13.25
30.33
24.30
28.29
25.32
27.27
13.80
24.56
10.60
9.59
24.01
22.22
21.52
16.84
10.06
10.13
18.87
27.36
15.55
22.47
24.06
20.21
9.31
11.04
22.42
13.80
7.59
8.05
7.24
6.90
12.30
23.11
15.52
17.25
<
.0001
<
.0001
<.0001
<.0001
<.0001
<.0001
<
0
1
1
2
.0001
<
1
1
2
2
3
3
1
1
2
2
3
3
0
1
0
1
0
1
.0001
<
.0001
<
.0001
<
.0001
<.0001
<.0001
<.0001
<.0001
<
1
2
1
2
1
2
1
2
1
2
1
2
1
2
1
2
1
2
1
2
1
2
.0001
<
.0001
<
.0001
<
.0001
<.0001
<.0001
<.0001
<.0001
<
0
0
1
1
0
0
1
1
0
0
1
1
0
0
1
1
.0001
<
1
1
1
1
2
2
2
2
3
3
3
3
.0001
<
.0001
<
.0001
<
.0001
<.0001
<.0001
<.0001
<.0001
<
.0001
<
.0001
<
.0001
Figure 12.28
Descriptive statistics.
preferred the detergent with granules when the powder was white and
when it was packaged in an aqua box.
12.14 PERFORMING THE POST HOC ANALYSIS IN SAS
To perform the simple effects analysis in
SAS Enterprise Guide
, configure
the analysis as shown above. Then in the
Least Squares Post Hoc Tests