Information Technology Reference
In-Depth Information
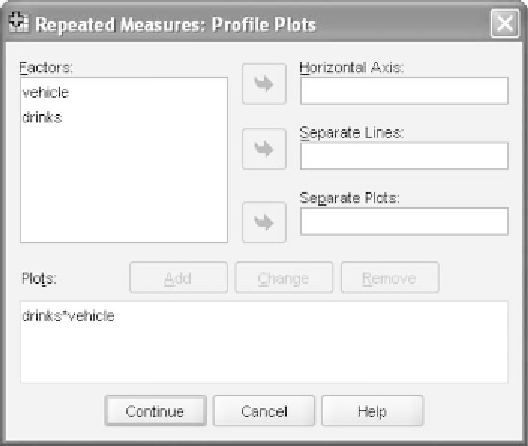
Figure 11.11
The
Plots
window.
from the drop-down menu, and click
Change
. The contrasts in parenthe-
sesnexttoeachvariablenamewillnowsay
None
as shown in Figure 11.9
(you should note that most of the recent versions of SPSS will ignore the
request to run no contrasts and will perform polynomial contrasts if one
of the other contrasts is not selected). Click
Continue
to return to the
main dialog window.
In the bottom portion of the window labeled
Display
,check
Descrip-
tive statistics
to output the observed means and standard deviations
as shown in Figure 11.10. Click
Continue
to return to the main dialog
window.
Click the
Plots
pushbutton to set up the plot for the interaction should
it be found to be significant. We place
drinks
on the horizontal axis for
three reasons: (a) it is conceptually more continuous than
vehicle
;(b)it
has more levels than
vehicle
and thus would have produced more lines
had we designated this variable for
Separate Lines
; (c) it matches with the
way we drew the design matrix in Figure 11.1. We show the
Plots
window
in Figure 11.11 just after clicking the
Add
pushbutton to register the plot
with SPSS. Click
Continue
to return to the main dialog window and
OK
to run the omnibus analysis.
11.8 SPSS OUTPUT FOR THE OMNIBUS ANALYSIS
Figure 11.12 shows two small tables from the initial portion of the output.
The
Within-Subjects Factors
table presents the levels of the repeated
measures; SPSS reports the levels of each in the left portion and the actual
variables corresponding to the cells in the right portion of the table.