Information Technology Reference
In-Depth Information
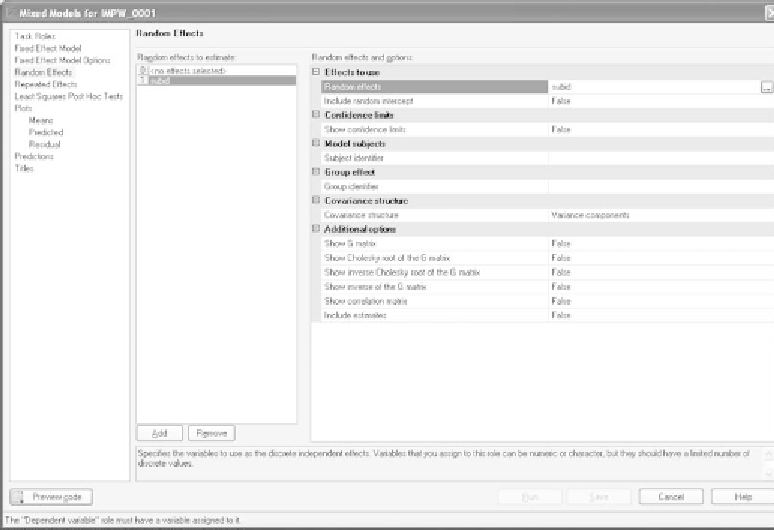
Figure 10.25
Selecting
Subject identifier
under
Model subjects
.
conclude that the intensity of symptoms differed across the time periods
measured. Such a numerical difference is due to different algorithms used
by SAS and SPSS to analyze within-subjects variables. This difference is
duetotheuseofsubjectsasarandomeffectinthegeneralmodelthatSAS
builds in while it performs the statistical analysis; SPSS does not identify
subjects as a random effect in its model.
10.18 PERFORMING THE POST-ANOVA ANALYSIS IN SAS
With a statistically significant effect obtained for the five-level within-
subjects variable, we need to perform a multiple comparisons procedure to
determine which means are significantly different from which others. Set
up the analysis exactly as described for the omnibus analysis. In the
Least
Squares Post Hoc Tests
window, click on
Show p-values for differences
and select
All pairwise differences
. Just below that is the
Adjustment
method for comparison
menu. We will perform a
Bonferroni
correction
on our comparisons. This is shown in Figure 10.29. Click
Run
to perform
this analysis.
10.19 SAS OUTPUT FOR THE POST-ANOVA ANALYSIS
ThepairwisemeancomparisonsareshowninFigure10.30.Theconditions
that are being compared are in the second and third columns in the
display. We can also see Student's
t
value analyzing that mean difference