Information Technology Reference
In-Depth Information
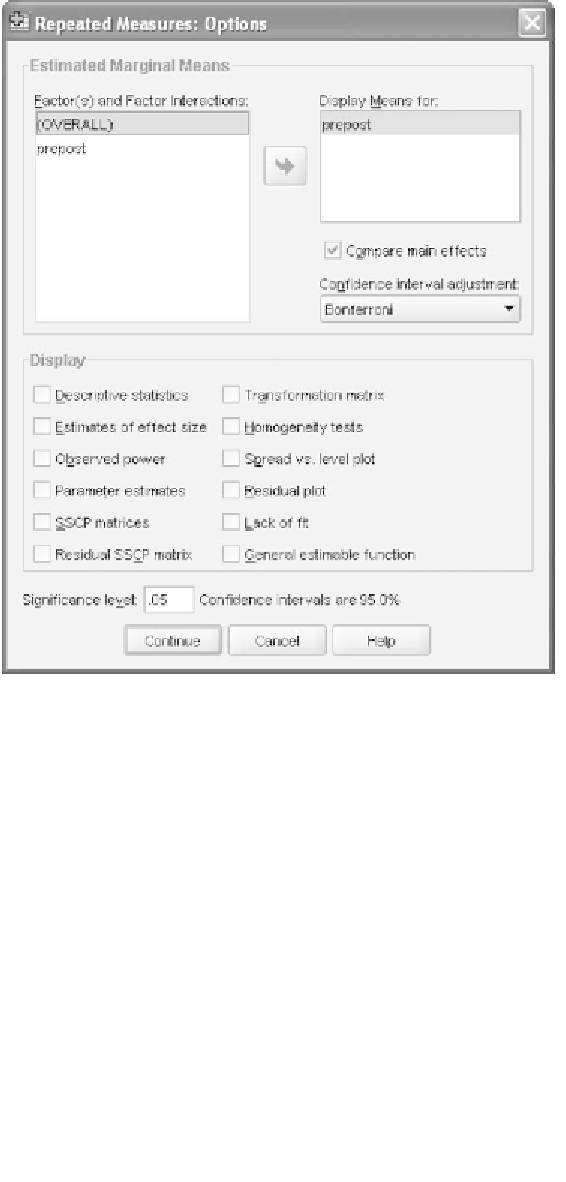
Figure 10.15
The
Options
dialog window set up to have SPSS perform paired com-
parisons on the levels of the within-subjects variable.
10.14 SPSS OUTPUT FOR THE POST-ANOVA ANALYSIS
The estimated marginal means are shown in Figure 10.16. With equal
sample sizes in repeated measures designs, these means are equal to the
observed means shown in the
Descriptive statistics
output. The value
Estimates
Measure: MEASURE_1
95% Confidence Interval
prepost
1
2
3
4
5
Mean
Std. Error
Lower Bound
Upper Bound
9.125
.718
7.427
10.823
9.000
.681
7.389
10.611
6.375
.375
5.488
7.262
5.250
.366
4.385
6.115
5.125
.350
4.296
5.954
Figure 10.16
Estimated marginal means.