Information Technology Reference
In-Depth Information
Linear Models
The GLM Procedure
Least Squares Means
Adjustement for Multiple Comparisons: Bonferroni
satisfac
LSMEAN
LSMEAN
Number
kidshome
voter
politics
1
1
1
1
1
1
2
2
2
2
2
2
1
1
1
2
2
2
1
1
1
2
2
2
1
2
3
1
2
3
1
2
3
1
2
3
1
2
3
4
5
6
7
8
9
10
11
12
36.0000000
14.0000000
10.0000000
35.0000000
32.0000000
15.0000000
33.0000000
35.0000000
20.0000000
28.0000000
18.0000000
36.0000000
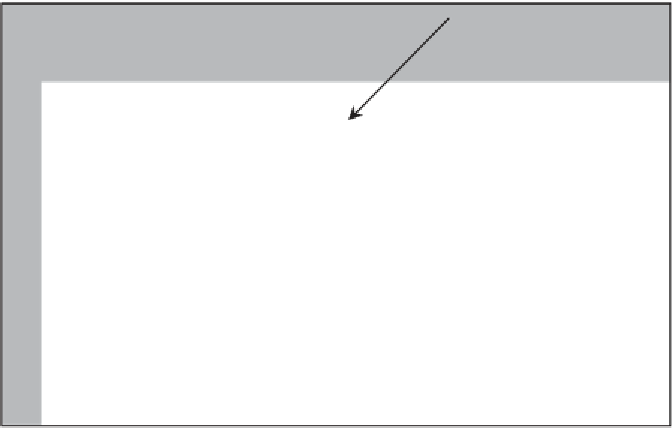
The difference between
group 1 (Kids in home,
voted, liberals) and group
6 (Kids in home, not voted,
conservative) is
statistically significantly
different.
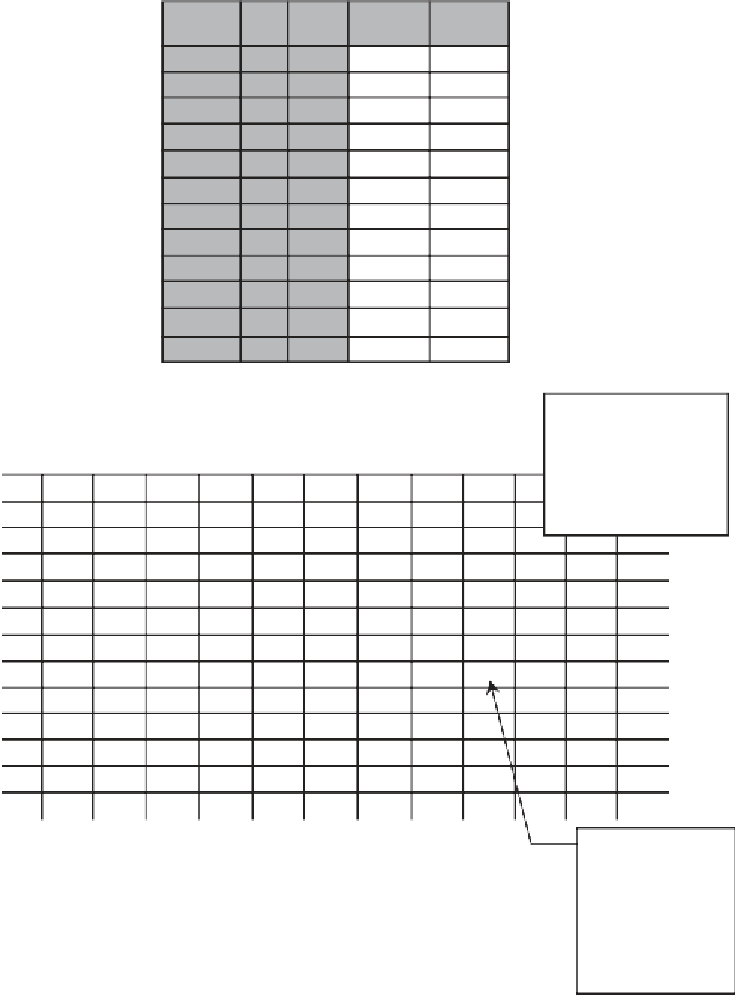
Least Squares Means for effect kidsho*voter* politics
Pr
>
⏐
t
⏐
for H0: LSMean(i)=LSMean(j)
Dependent Variable: satisfac
i/j
1
2
3
4
5
6
7
8
9
1
2
3
4
5
6
7
8
9
10
11
12
<.0001
<
.0001
1.0000
1.0000
<.0001
<
1.0000
0.0011
<.0001
1.0000
<.0001
1.0000
1.0000
0.0002
0.0026
1.0000
0.0004
<.0001
1.0000
1.0000
0.0011
1.0000
<.0001
<.0001
1.0000
1.0000
0.0002
1.0000
0.0061
1.0000
0.6878
0.0144
0.1611
1.0000
0.0741
0.0144
1.0000
<.0001
<.0001
1.0000
1.0000
<.0001
1.0000
1.0000
0.0061
1.0000
0.0011
1.0000
0.0331
0.0011
1.0000
1.0000
0.0741
1.0000
1.0000
1.0000
1.0000
1.0000
0.0026
0.0331
1.0000
0.0144
0.0026
1.0000
0.6878
<
.0001
1.0000
<.0001
0.0011
1.0000
0.0004
<.0001
1.0000
0.0331
1.0000
<.0001
.0001
<
.0001
1.0000
1.0000
<.0001
1.0000
1.0000
0.0061
1.0000
0.0011
<
.0001
<
.0001
1.0000
<.0001
<.0001
0.6878
0.0011
1.0000
<.0001
1.0000
0.0002
1.0000
1.0000
0.0144
1.0000
0.0026
1.0000
0.0026
1.0000
1.0000
0.1611
1.0000
0.1611
1.0000
0.0011
0.0002
1.0000
0.0741
1.0000
<.0001
1.0000
0.0741
1.0000
0.0144
1.0000
0.0144
1.0000
0.0026
1.0000
1.0000
1.0000
0.0061
0.6878
1.0000
0.0011
The difference
between group 7 (Kids
not at home, voted,
liberal) and group 9
(Kids not at home,
voted, conservative) is
not statistically
significantly different.
Figure 9.28
Tests of simple effects.