Information Technology Reference
In-Depth Information
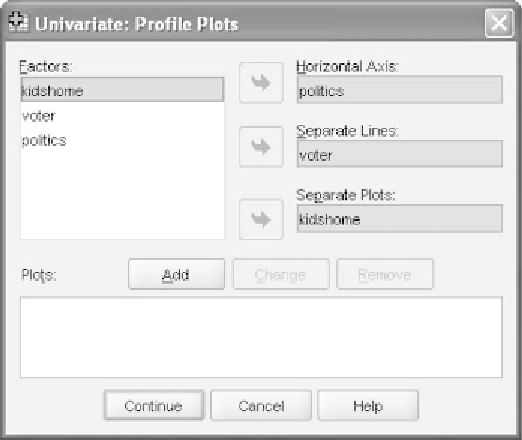
Figure 9.7 Plots
dialog window.
panel labeled
Factor(s) and Factor Interactions
to the right panel labeled
DisplayMeans for
. The bottom half of the
Options
window concerns the
observed means. Under the
Display
heading, check
Homogeneity tests
and
Descriptive statistics
.
Clicking the
Plots
pushbutton presents the dialog window shown in
Figure 9.7. From the
Factors
panel, click
politics
over to the
Horizontal
Axis
panel, click
voter
over to the
Separate Lines
panel, and then click
kidshome
under separate plots. Then click
Add
to register the plot with
SPSS. Doing so will place
politics
∗
∗
kidshome
in the
Plots
panel
at the bottom of the window. Clicking
Continue
returns us to the main
dialog window. Now click
OK
to run the omnibus analysis.
voter
9.7 SPSS OUTPUT FOR THE OMNIBUS ANALYSIS
Wepresenthereselectedoutputoftheanalysis.Thedescriptivestatistics
that we requested in the
Options
dialog window is shown in Figure 9.8
as a
Descriptive Statistics
table. Since we originally clicked over the inde-
pendent variables in the main dialog window in the order
kidshome
,
voter
,and
politics
, SPSS kept that ordering in its output. Because of this
ordering, in reporting the cell means and standard deviations,
liberal
,
moderate
,and
conservative
are shown for each level of
voter
(yes and
no) for each level of
kidshome
.
The means for the
politics
variable are most easily seen in the
Descrip-
tives Statistics
table, but the means for all of the effects are actually con-
tained in this output. For example, the top third of the table represents the