Information Technology Reference
In-Depth Information
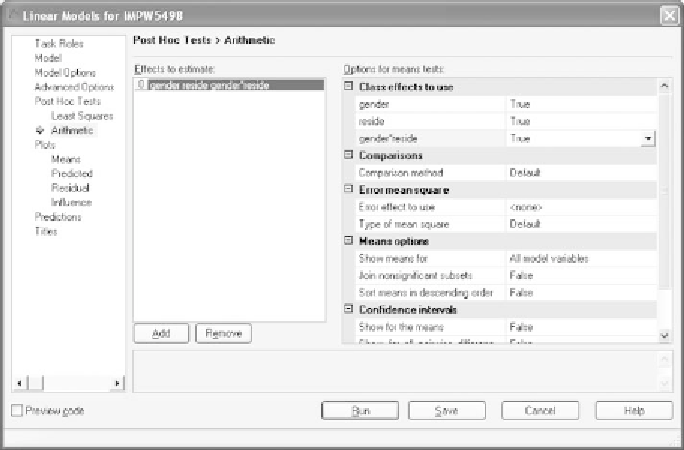
Figure 8.27
The descriptive statistics for the effects are now specified.
Descriptive summary statistics can be requested on the
Arithmetic
portion of the
Post Hoc Tests
tab. This was described in Section 6.8.3, and
we will summarize what you should specify here. Clicking
Add
displays a
set of drop-down menus, only a few of which need modifying. For
Class
effects to use
, select
True
for
gender, reside
,and
gender
reside
.Wewill
not request a
Homogeneity of variance
test as SAS does not compute this
for factorial models. The specifications that we have selected are displayed
in Figure 8.27. Then click
Run
to perform the analysis.
∗
8.14 SAS OUTPUT FOR THE OMNIBUS ANALYSIS
The descriptive statistics generated by
LinearModels
are shown in Figure
8.28. The mean, standard deviation, and the number of observations are
displayedforthetwomaineffectsaswellasfortheinteraction.
The summary table for the model in the omnibus analysis is presented
in the top portion of Figure 8.29. Note that SAS provides the
Corrected
Total
sum of squares, informing us that we are viewing the results of the
reduced model. The sum of squares associated with
Model
is a compilation
of the sums of squares for the three effects (two main effects and one
two-way interaction) that comprise the model (each effect is treated as a
predictor in the model). The last table in Figure 8.29 shows the partitioning
of the effects comprising the model. As can be seen, all three effects are
statistically significant.
The middle portion of Figure 8.29 presents
RSquare
; this is an alter-
native label for eta squared. However,
RSquare
is computed based on the