Information Technology Reference
In-Depth Information
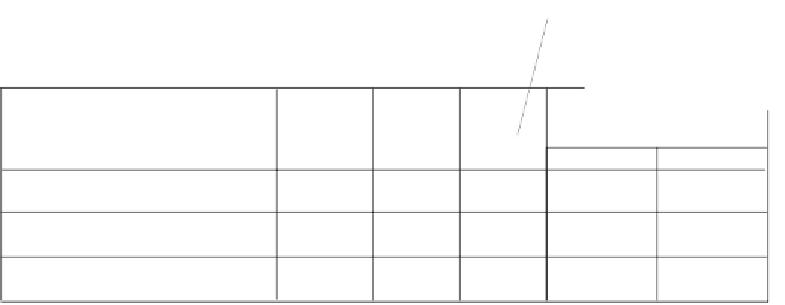
These are the probabilities
of the differences occurring
by chance alone for the
pairwise comparisons for
reside only.
Multiple Comparisons
Dependent Variable: range 0-60
Tukey HSD
Mean
Difference
(I-J)
95% Confidence Interval
(I) city reside size
(J) city reside size
Sig.
Upper Bound
Std. Error
Lower Bound
large
small
rural
large
rural
large
small
- 17.5000*
2.71416
.000
- 24.2780
- 10.7220
- 10.5000
*
2.71416
.002
- 17.2780
- 3.7220
small
17.5000
*
2.71416
.000
10.7220
24.2780
7.0000*
2.71416
.042
.2220
13.7780
rural
10.5000
*
2.71416
.002
3.7220
17.2780
- 7.0000
*
2.71416
.042
- 13.7780
- .2220
Based on observed means.
*. The mean difference is significant at the .05 level.
Figure 8.19
Post hoc analysis of the
reside
main effect.
Focusing next on the residence location of our respondents, we learned
from the simple effects analysis that there was no difference between
females and males in large cities but that the other two locations were
associated with statistically significant differences between the genders.
Of particular note is the finding that females are quite lonely in rural
communities but that their male counterparts are remarkably not lonely.
8.12.4 MAIN EFFECTS POST HOC ANALYSES: RESIDE
Figures 8.19 and 8.20 present the results of the post hoc Tukey HSD test
onthemaineffectof
reside
. We discussed the structure of these tables in
the last chapter. As can be seen, each level differs significantly from each
other. But, because this variable is involved in a statistically significant
interaction, the story that is told by these main effect results is clearly far
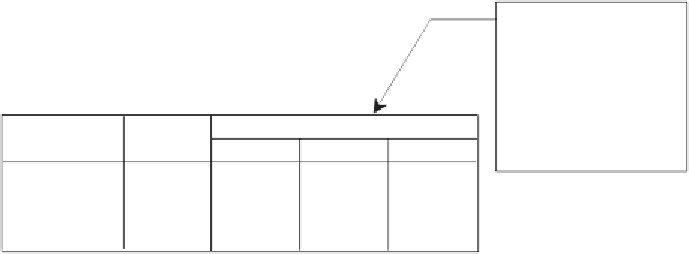
Because each mean is in
its own column, they are
all significantly different
from each other. However,
we see a nonsignificant
p
value of 1.000 because
each mean is compared
to itself.
range 0-60
Tukey HSD
a,b
Subset
city reside size
large
rural
small
Sig.
N
1
2
3
10
15.5000
10
26.0000
10
33.0000
1.000
1.000
1.000
Means for groups in homogeneous subsets are displayed.
Based on Type III Sum of Squares
The error term is Mean Square(Error)
36.833.
a.
Uses Harmonic Mean Sample Size
=
=
10.000.
b.
Alpha
=
.05.
Figure 8.20
Homogeneous subgroups based on the outcome of the Tukey multiple
comparisons test.