Information Technology Reference
In-Depth Information
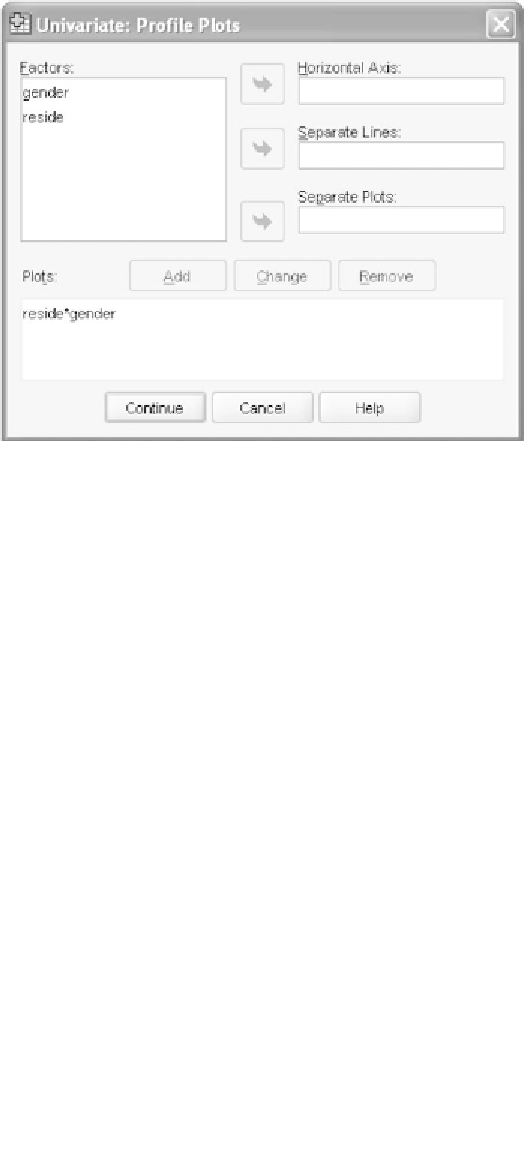
Figure 8.9 GLMUnivariate Plots
dialog window.
listed. Had we clicked them over in the other order, the main rows would
have been organized by size of city and male and female means would
have been shown for large cities, then small cities, then rural towns.
The
GLMUnivariate
procedure uses the Levene test to determine if the
assumption of homogeneity of variance has been met. From Figure 8.11
we see that the
F
ratio for that test is not significant; we may thus conclude
that the data meet the homogeneity of variance assumption.
The summary table for the omnibus analysis is shown in Figure 8.12,
and duplicates the information we presented in Table 8.1. As we already
know, the main effects of
gender
and
reside
as well as the interaction are
Descriptive Statistics
Dependent Variable: range 0-60
Std.
Deviation
gender
female
city reside size
large
small
rural
Total
large
small
rural
Total
large
small
rural
Total
Mean
N
15.0000
5.52268
5
38.0000
6.67083
5
42.0000
6.51920
5
31.6667
13.61022
15
male
16.0000
5.52268
5
28.0000
6.51920
5
10.0000
5.52268
5
18.0000
9.46422
15
Total
15.5000
5.23344
10
33.0000
8.15135
10
26.0000
17.80137
10
24.8333
13.45256
30
Figure 8.10
Descriptive statistics for the cells.