Information Technology Reference
In-Depth Information
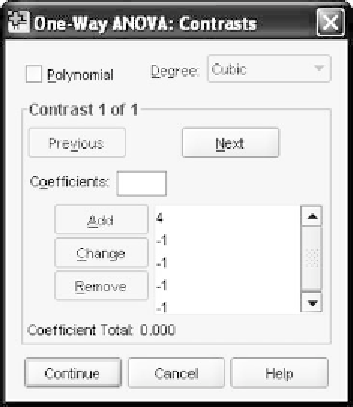
Figure 7.24
The
Contrasts
window.
7.28 PERFORMING USER-DEFINED CONTRASTS IN SPSS
Open your data file. From the main menu, select
Analyze
Compare
➜
Means
One-Way ANOVA.
That will bring you to the main dialog
window for the procedure as shown earlier in Figure 7.2. Configure it
with
group
as the
Factor
and
satscore
in the
Dependent List
panel.
Click the
Contrasts
pushbutton to reach the
Contrasts
dialog win-
dow shown in Figure 7.24. Make sure that
Polynomial
is
not
checked.
We will be using the large middle area where you see
Contrast 1 of 1
and a
Coefficients
panel with the cursor in it. Here is how this window
works:
➜
Contrast 1 of 1
counts our contrasts. We have three of them to
enter. Each contrast will involve us entering the five weights that we
constructed in Table 7.5. We have three contrasts to enter, and we
enter them separately contrast by contrast.
Coefficients
has a little panel next to it. This is where you enter the
coefficients or weights that we have constructed in Table 7.5. Focus
on the first contrast. The first weight is 4 and that is what you type
into the little panel. Then click
Add
. This will transfer the weight into
the large panel in the middle of the window. Type the next weight
(
1) and click
Add
to transfer this weight into the large panel. As
you do this you will see the weights line up in a column in the large
panel as shown in Figure 7.21. Continue in this manner until you
have finished with the first contrast.
−
SPSS will keep track of the total of the coefficients as you enter them.
When you have finished with the first contrast, you should verify
that the
Coefficient Total
is 0. This means you have correctly input