Information Technology Reference
In-Depth Information
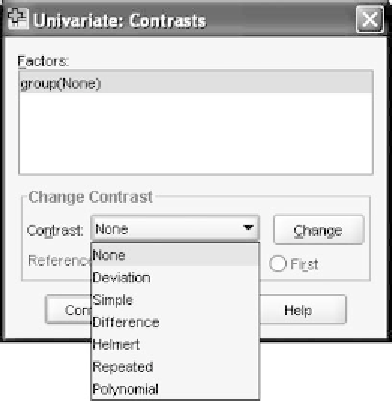
Figure 7.14 Contrasts
win-
dow with drop-down menu.
Clicking the
Change
pushbutton to register your choice with SPSS pro-
duces what is shown in Figure 7.16. Note that
Simple
is now in parentheses
next to the independent variable, with
first
indicated as the reference cat-
egory. Click
Continue
to return to the main
GLM
window. Then click
OK
to run the analysis.
7.17 THE SIMPLE CONTRASTS OUTPUT FROM SPSS
The output from the contrast analysis is labeled by SPSS as
Custom
Hypothesis Tests
and is shown in Figure 7.17. We had specified
First
(zero months of study) as our reference category; this instructed SPSS to
compare each of the other groups to this one group. As you can see from
the output, the
Contrast Estimate
on the first line of each major row
shows the mean difference between our reference group and the group to
Figure 7.15 Simple
con-
trasts with the
First
group as
the
Reference
Group.