Information Technology Reference
In-Depth Information
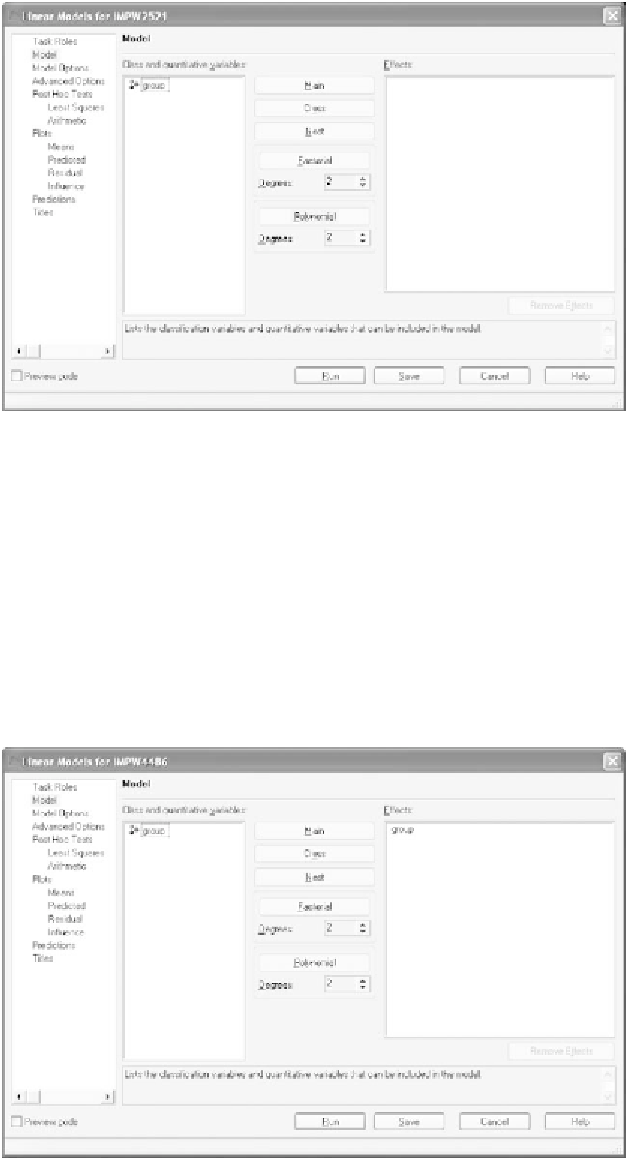
Figure 6.12
The initial
Model
screen.
Click on the
Model
tab to display the screen shown in Figure 6.12.
The variable
group
, our independent variable, appears in the
Class and
quantitativevariables
panel. Highlighting that variable activates the
Main
bar in the middle of the screen; click
Main
to place
group
in the
Effects
panel as shown in Figure 6.13.
Click on the
Model Options
tab. The only specification we need for
our analysis is to request output associated with the
Type III
sums of
squares (see Figure 6.14).
Descriptive summary statistics can be requested on the
Arithmetic
portion of the
Post Hoc Tests
tab. When you select it, you see the blank
Figure 6.13
The configured
Model
screen.