Environmental Engineering Reference
In-Depth Information
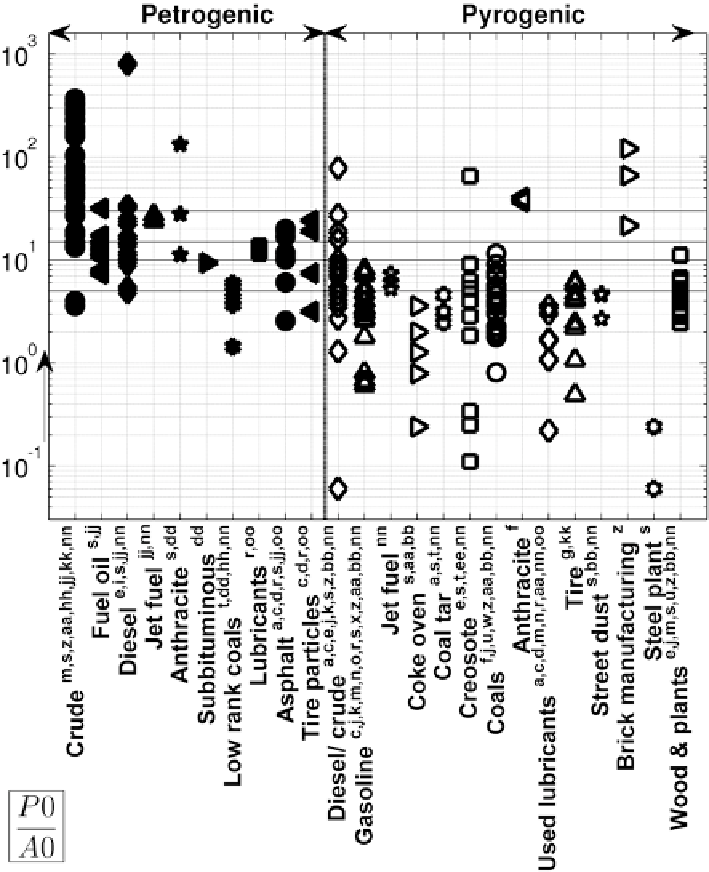
Fig. 9
Mean, maximum and minimum values of
P0
/
A0
ratio (
Y
-
axis
in logarithmic scale) for dif-
ferent PAH sources (
X
-
axis
), as reported in the literature (see Table 5 in appendix). The
vertical
dashed line
divides the graph into petrogenic (
left
) and pyrogenic (
right
) sources.
Horizontal con-
tinuous lines
indicate the thresholds used to distinguish pyrogenic and petrogenic products dis-
cussed in the text. Degradation
arrow
(
left
of graph, by the
Y
-
axis
) shows the change in P0/A0 with
most types of degradation. However, P0 is more soluble than A0 (see text for more information)
In water, both P0 and A0 follow similar first order photodegradation kinetics
when not attached to particles, although humic substances protect P0 but not A0
(Bertilsson and Widenfalk
2002
). P0 is more soluble than A0 (P0/A0 decreases as
dissolution increases) (Table
2
), otherwise A0 is more degradable than P0 (ratio
increases as the degradation proceeds). However, P0 in soils biodegrades more
Search WWH ::

Custom Search