Environmental Engineering Reference
In-Depth Information
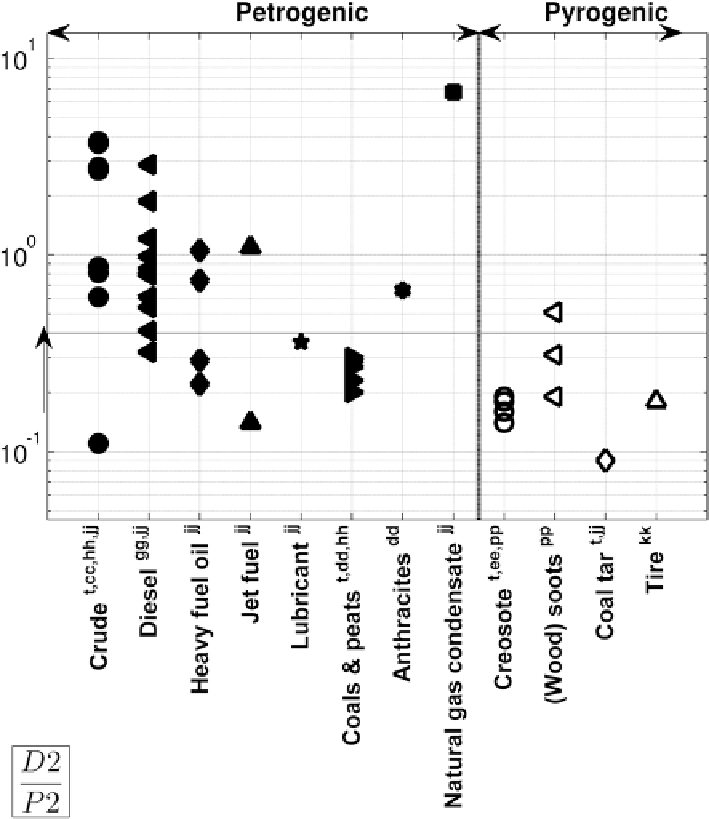
Fig. 17
The ratio of
D2
/
P2
. Evaporation leads to opposite
degradation arrow
direction
(i.e., decreases ratio). See Fig.
9
for the symbols and the text for explanation
Using the double ratio plot of D2/P2 versus D3/P3, Wang et al. (
1999b
) suffi-
ciently resolved burn products and diesel fuel. Pyrogenic sources (coal tar, creosote
and fire tire wipe) have values below 0.4 for both ratios (Fig.
17
; Neff et al.
1998
;
Stout et al.
2001a
; Wang et al.
1999b
,
2006
). Together with other PAH markers (e.g.,
D1, FL0, PY0), the D
n
/P
n
ratios have been used to characterize pyrogenic products
mixed with petrogenic ones (Wang et al.
1999a
,
2001
).
The D
n
/P
n
ratios have been used to identify petrogenic sources (crudes, diesels,
etc.) of different origin; for example, in the studies of the Gulf War and of the 1989
Exxon Valdez oil spills and their weathering products (Hostettler et al.
2007
; Kim
Search WWH ::

Custom Search