Information Technology Reference
In-Depth Information
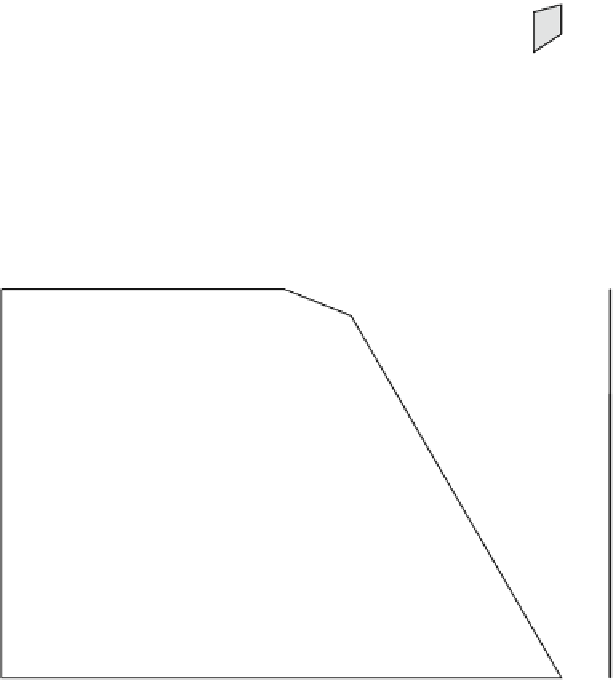
Fig. 12.43
Density model along the E-W profile crossing central Oregon; (1) model, (2) observa-
tions. Numbers indicate densities in g/cm
3
(Romanyuk et al., 2001a)