Information Technology Reference
In-Depth Information
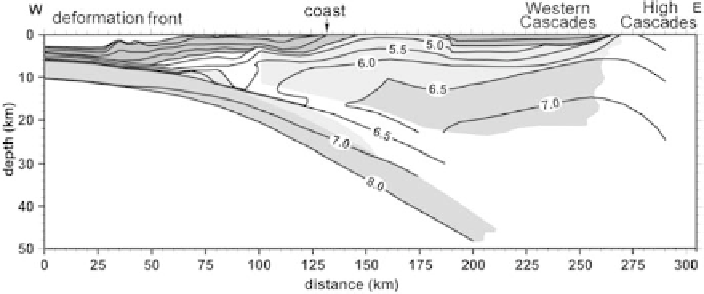
Let us consider the most comprehensive seismic model of the central Cascadia
subduction zone developed by Trehu et al. (1994). It is based on reflection data and
natural seismicity observations. Figure 12.42 shows the velocity section along an
E-W profile near the Lincoln line. The downgoing slab with velocities increasing
from 6.5 to 8 km/s is clearly recognizable. The continental part of the seismic section
is characterized by a more or less gently dipping bedding, with a monotonic increase
in the velocities from 5 km/s at depths of 1-2 km to 7 km/s at depths of about 20
km. No P-wave velocity inversion was discovered within the crust.
According to seismic refraction data, the near-surface P-wave velocities range
from 2.9 to 5.2 km/s. The upper and middle crust at depths of 3-30 km is character-
ized by velocities of 6.1-6.5 km/s. Beneath the High Cascades, the lower crust at a
depth of 45 km has a velocity of about 7 km/s. The Moho is fixed at a depth of 45
km. Importantly, a low-velocity layer was identified, although not very reliably, in
the middle crust.
Gravity data were used by Romanyuk et al. (2001a) to construct a two-
dimensional density stratification model of the Cascadia subduction zone along
a profile crossing central Oregon (Fig. 12.43). The oceanic crust has densities of
1.90-2.45 g/cm3 (sediments), 2.79 g/cm3 (basalts and dolerites), and 3 g/cm3 (gab-
bros and ultramafic rocks). The oceanic mantle to a depth of 40 km has a density
of 3.33-3.35 g/cm3 (lithosphere). In a depth range of 40-140 km, its density is
reduced to 3.3 g/cm3 (asthenosphere). The densities of the oceanic lithosphere and
asthenosphere increase as they subduct under the continent.
Next examine the data of numerous measurements of the heat flow and tem-
perature gradient. Near the Coast Range and the Willamette Valley, the heat flow
amounts to 40 mW/m
2
and the temperature gradient is about 30
◦
C/km. These values
increase in the Western Cascades and they reach 105 mW/m
2
and 65
◦
C/km in the
High Cascades. Here we encounter a lot of hot springs. The Cascades heat flow
maximum is attributed to the influence of an extensive magma chamber at depths of
Fig. 12.42
Deep seismic section along an E-W profile close to the Lincoln line. Numbers indicate
P-wave velocities in km/s (Trehu et al., 1994)