Information Technology Reference
In-Depth Information
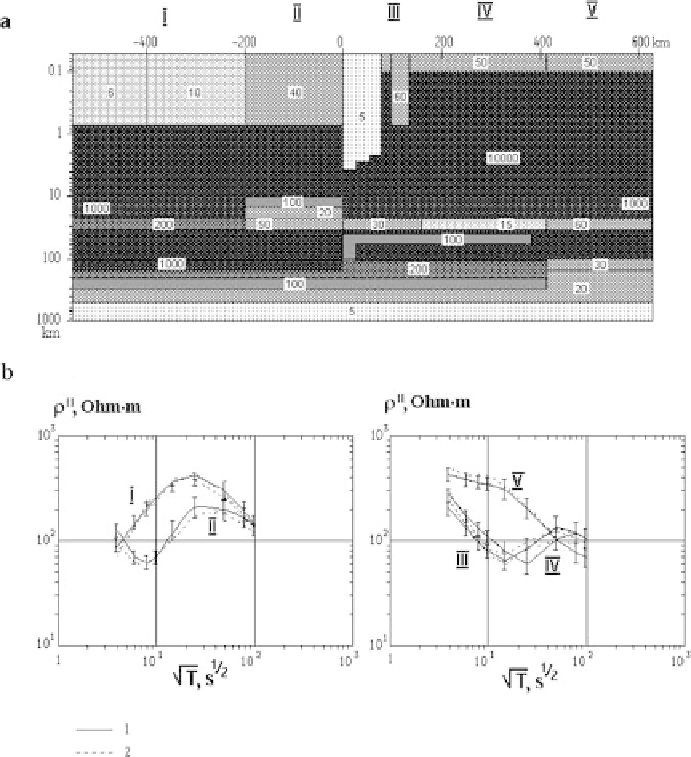
Fig. 12.34
Interpretation of
A
-curves in the mantle-diapir model class. (
a
) TE-inversion; Roman
numerals - numbers of zones, Arabic numerals -values of resistivity in Ohm
·
m; (
b
) relation
-curves
between experimental (1) and model (2)
upper crust and lower lithosphere of the western (I, II, III) and southeastern (V, VI)
zones: resistivities increase to 10000 Ohm
·
m in I, II, III zones and decrease to 1000
and 500 Ohm
m in V, VI zones. At the same time, the mantle resistivity under the
platform (I, II, III) increases to 100 Ohm
·
m at depths of 300-500 km. The iterations
provide accurate inversion within zones I, II, III and VI, where the
rms
misfit does
not exceed 16%. However, the model and experimental apparent-resistivity curves
diverge dramatically in zones IV and V, in the vicinity of the Baikal rift, where
misfits of their low-frequency branches amount to 90%, considerably exceeding the
errors of apprent-resistivity synthesis.
·