Information Technology Reference
In-Depth Information
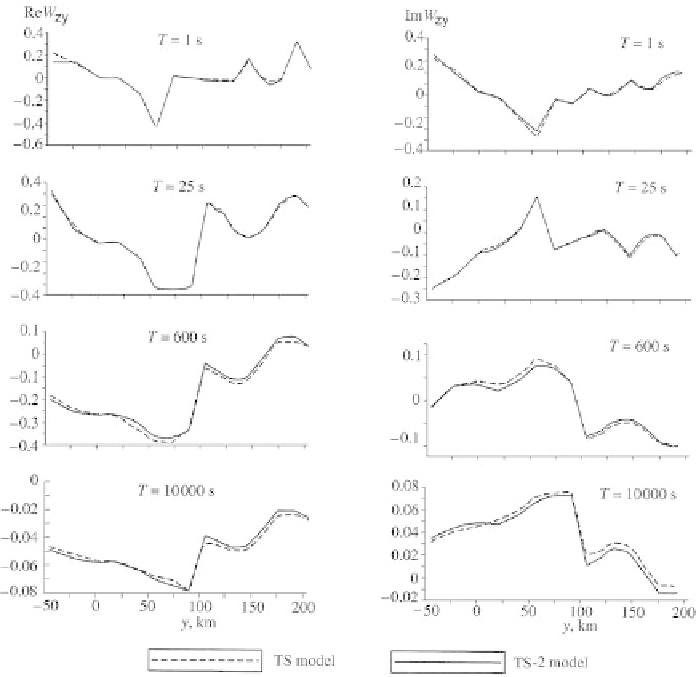
Fig. 12.21
Comparison of tippers Re
W
zy
,Im
W
zy
from the TS-2 and TS models
−
−
−
inversion of the undistorted
curves. If
and
curves meet the dispersion
−
relations, the disregard of the
curves does not lead to a loss of information.
−
We interpreted the
curves using the starting model TS-2, obtained from the
tipper inversion. Inversion of
was performed with fixed resistivities of the sedi-
mentary cover. It resulted in the model, which is referred to as the TS-3 model. The
model is shown in Fig. 12.22. The divergences between the phases from the TS-3
model and initial TS model do not exceed 2.5
◦
(Fig. 12.23). Comparing the TS-3
and TS-2 models, we see that the phase inversion agrees reasonably well with the
tipper inversion. Two points are of particular interest: (1) the edge resistivities of
the inhomogeneous crustal layer (343 and 10 Ohm
·
m) became closer to their true
values (300 and 10 Ohm
m), and (2) the contrast between the nonconductive and
conductive mantle became sharper (3801 Ohm
·
·
m/15Ohm
·
m in the TS-3 model
against 1000 Ohm
m in the initial TS model). Thus, the phase inversion
visibly improved the accuracy of the stratification.
3. Inversion of the transverse apparent resistivity and impedance-phase,
·
m/10Ohm
·
⊥
and
⊥
. At this stage we pass on to the TM-mode, which is sensitive to galvanic effects.