Information Technology Reference
In-Depth Information
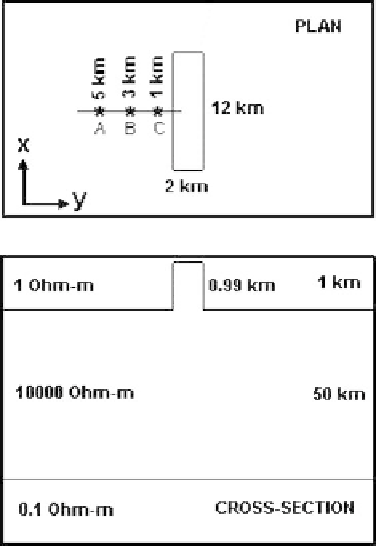
Fig. 12.9
Model with a
three-dimensional horst-like
resistive elevation in the
sediments; A,B,C -sounding
sites and their distance to
elevation edge
3
D
- and
2
D
-curves will be violated. Figure 12.10 shows the three-dimensional
transverse and longitudinal curves of
3
D
obtained along the central profile
at different distances from the horst edge (5, 3 and 1 km, sites A,B and C respec-
tively). Also shown are the two-dimensional curves of
3
D
and
2
D
corresponding to
the model with the infinitely long horst, and the locally normal curves of
2
D
and
n
corre-
sponding to the model without a horst. It is notable that at all sites the longitudinal
curves of
3
D
practically coincide with the
2
D
- and
n
-curves. Clearly, they allow for
two-dimensional and even one-dimensional inversion. At the same time the trans-
verse
2
D
-curves, and this fall drastically increases in
the immediate vicinity of the horst. At site C (1 km from the horst) the
3
D
-curves drop below the
2
D
-curve
tips over, and the degree of its distortion is almost the same as in the case of lon-
gitudinal
3
D
-curve in the model with a conductive prism. Going to the impedance
phases, we note that fall of the
3
D
-curves is accompanied by severe deformation of
3
D
-curves. These properties of the around-flow effect indicate its galvanic-
inductive nature (intensity of current around-flow is governed by horizontal skin-
effect in the conductive medium surrounding a resistive body). Needless to say that
the formal two-dimensional inversion of the transverse curves of
3
D
and
3
D
will
introduce a spurious conductor.
The around-flow effect is observed quite often in foothills. Figure 12.11 presents
the longitudinal (
⊥
) apparent-resistivity curves measured along
a profile crossing the Precaucasian foredeep (Berdichevsky and Dmitriev, 1976).
) and transverse (